HeatmapAxis Class
Contains settings for heatmap axes.
Namespace: DevExpress.XtraCharts.Heatmap
Assembly: DevExpress.XtraCharts.v21.2.dll
NuGet Package: DevExpress.Charts
Declaration
Related API Members
The following members return HeatmapAxis objects:
| Library | Related API Members |
|---|---|
| Cross-Platform Class Library | HeatmapHitInfo.Axis |
| WinForms Controls | HeatmapControl.AxisX |
| HeatmapControl.AxisY |
Remarks
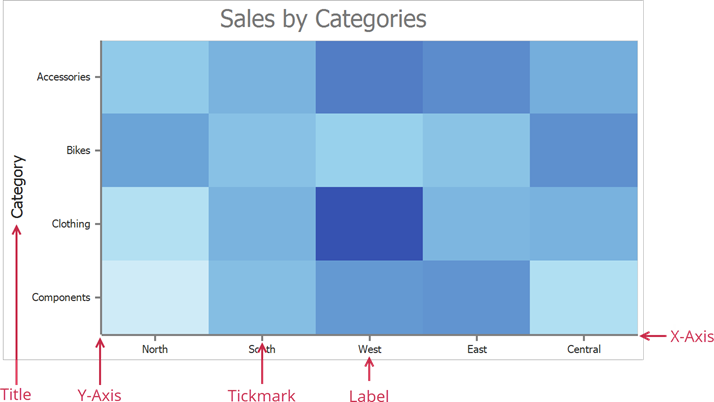
The HeatmapAxis class contains options that allow you to configure appearance, access label and tickmark settings, and add titles to heatmap x- and y-axes.
Use the HeatmapControl.AxisX and HeatmapControl.AxisY properties to access heatmap axis settings.
using DevExpress.XtraCharts;
using DevExpress.XtraCharts.Heatmap;
using System;
using System.Drawing;
using System.Windows.Forms;
namespace HeatmapMatrixAdapterSample {
    public partial class Form1 : Form {
        public Form1() {
            InitializeComponent();

            HeatmapControl heatmap = new HeatmapControl();
            this.Controls.Add(heatmap);
            // ...
            // The Heatmap Control configuration is skipped.
            // ...
            heatmap.AxisX.Name = "axisX";
            heatmap.AxisY.Name = "axisY";
        }
    }
}
If you want to hide an axis, set its Visibility property to DefaultBoolean.False.
Enable the axis Reverse property to show axis labels and position cells in reversed order.
Configure Axis Labels
Use an axis’s Label property to access heatmap axis label settings. The example below configures label alignment, rotation, format pattern, and border settings:
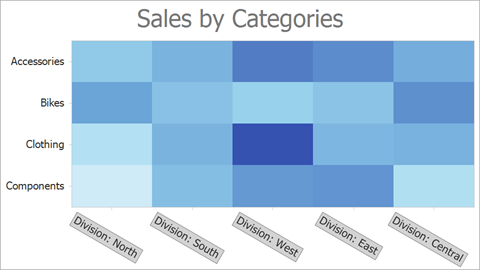
AxisLabel2D label = heatmap.AxisX.Label;
label.Alignment = AxisLabelAlignment.Near;
label.Angle = 30;
label.BackColor = Color.LightGray;
label.Border.Visibility = DevExpress.Utils.DefaultBoolean.True;
label.Border.Thickness = 1;
label.Border.Color = Color.Gray;
label.TextPattern = "Division: {X}";
Add Custom Axis Labels
You can display custom labels with default labels or in place of default labels. The adapter creates default labels based on cell arguments. Use the CustomLabels property to access an axis’s custom label collection. The following example displays a custom label on an x-axis:
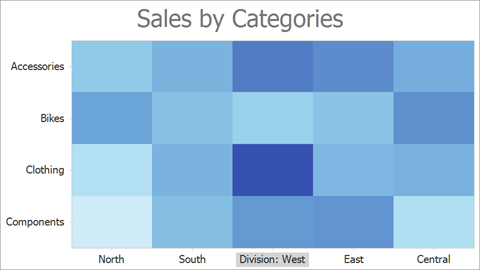
heatmap.AxisX.CustomLabels.Add(new CustomAxisLabel {
    AxisValue = "West",
    Name = "Division: West",
    BackColor = Color.LightGray });
heatmap.AxisX.LabelVisibilityMode = AxisLabelVisibilityMode.AutoGeneratedAndCustom;
Specify Grid Step
Use the GridSpacing property to specify how frequently the Heatmap Control should plot its tickmarks and labels. The GridSpacing value is automatically calculated until the AutoGrid property is enabled.
Customize Axis Tickmarks
Use an axis’s Tickmarks property to access tickmark appearance settings. Note that tickmarks are painted the same color as the axis to which they belong. The tickmark frequency depends on the axis GridSpacing property value.

HeatmapTickmarks tickmarks = heatmap.AxisX.Tickmarks;
tickmarks.CrossAxis = true;
tickmarks.Length = 10;
tickmarks.Thickness = 4;
tickmarks.Visible = true;
Add Axis Title
You can accompany an axis with a single title that can be aligned along the axis. The Title property allows you to access title options. To show the title, enable the title’s Visibility property and specify the title Text.
heatmap.AxisY.Title.Visibility = DevExpress.Utils.DefaultBoolean.True;
heatmap.AxisY.Title.Text = "Category";
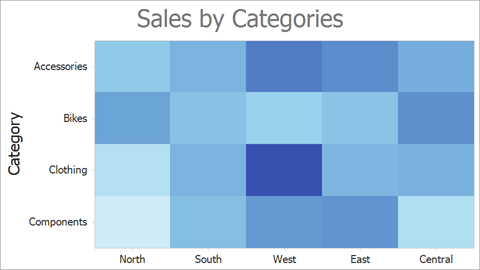
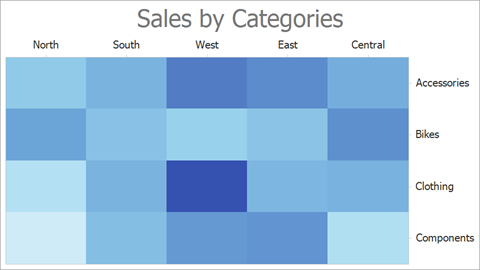
Specify Axis Position
Define the Alignment property to specify axis position. The following values are available:
- Near
The x-axis is positioned at the bottom of the chart, the y-axis – at the left.

- Far
The x-axis is positioned at the top of the chart, the y-axis – at the right.
heatmap.AxisX.Alignment = HeatmapAxisLabelAlignment.Far;
heatmap.AxisY.Alignment = HeatmapAxisLabelAlignment.Far;
Customize Axis Appearance
You can specify the axis color and thickness: