HeatmapBorder.Visibility Property
Gets or sets the heatmap border visibility.
Namespace: DevExpress.XtraCharts.Heatmap
Assembly: DevExpress.XtraCharts.v21.2.dll
NuGet Package: DevExpress.Charts
Declaration
[XtraChartsLocalizableCategory(XtraChartsCategory.Behavior)]
public DefaultBoolean Visibility { get; set; }Property Value
| Type | Description |
|---|---|
| DefaultBoolean | true if the border is visible; otherwise, false. |
Available values:
| Name | Description |
|---|---|
| True |
|
| False |
|
| Default | The default behavior determined by the control’s logic. |
Example
The following example shows how to configure heatmap cell label settings such as format, font, color, and so on.
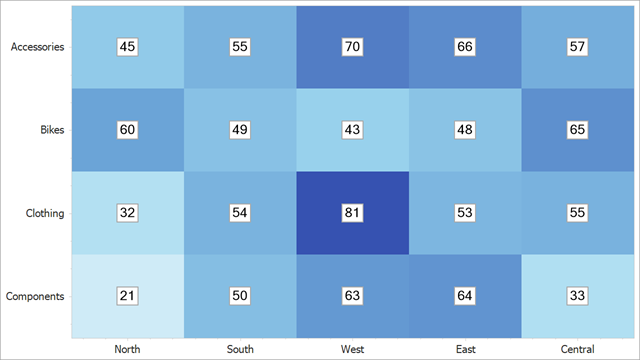
Use the HeatmapControl.Label property to access label settings:
using DevExpress.XtraCharts;
using DevExpress.XtraCharts.Heatmap;
using System;
using System.Drawing;
using System.Windows.Forms;

namespace HeatmapMatrixAdapterSample {
    public partial class Form1 : Form {
        public Form1() {
            InitializeComponent();

            HeatmapControl heatmap = new HeatmapControl();
            this.Controls.Add(heatmap);

            heatmap.Dock = DockStyle.Fill;

            HeatmapMatrixAdapter dataAdapter = new HeatmapMatrixAdapter();
            dataAdapter.XArguments = new string[] { "North", "South", "West", "East", "Central" };
            dataAdapter.YArguments = new string[] { "Components", "Clothing", "Bikes", "Accessories" };
            dataAdapter.Values = new double[,] {
                { 21.3, 50.1, 63.2, 64.4, 33.4 },
                { 32.3, 54.4, 81.3, 53.4, 54.9 },
                { 60.3, 49.1, 42.6, 48.4, 65.4 },
                { 45.3, 54.7, 70.3, 66.4, 56.6 }
            };
            heatmap.DataAdapter = dataAdapter;
            Palette palette = new Palette("Custom") { Color.White, Color.SkyBlue, Color.DarkBlue };
            RangeColorProvider colorProvider = new RangeColorProvider() { Palette = palette, ApproximateColors = true };
            colorProvider.RangeStops.Add(new Unit(0, UnitType.Percentage));
            colorProvider.RangeStops.Add(new Unit(20, UnitType.Absolute));
            colorProvider.RangeStops.Add(new Unit(40, UnitType.Absolute));
            colorProvider.RangeStops.Add(new Unit(60, UnitType.Absolute));
            colorProvider.RangeStops.Add(new Unit(90, UnitType.Absolute));
            colorProvider.RangeStops.Add(new Unit(1, UnitType.Percentage));
            dataAdapter.ColorProvider = colorProvider;

            HeatmapLabel label = heatmap.Label;
            label.Visible = true;
            label.Pattern = "{V:f0}";
            label.BackColor = Color.White;
            label.Color = Color.Black;
            label.Font = new Font("SegoeUI", 10);
            label.TextOrientation = DevExpress.XtraCharts.Heatmap.TextOrientation.Horizontal;
            label.Border.Visibility = DevExpress.Utils.DefaultBoolean.True;
            label.Border.Color = Color.DarkGray;
            label.Border.Thickness = 2;
        }
    }
}