Collect Diagnostic Logs
- 2 minutes to read
This topic describes how to use the Performance Monitor tool to report a performance problem. This tool analyzes the performance of CodeRush and records any issues in a log file.
If you experience any performance delay, follow the steps below:
Run Visual Studio as administrator.
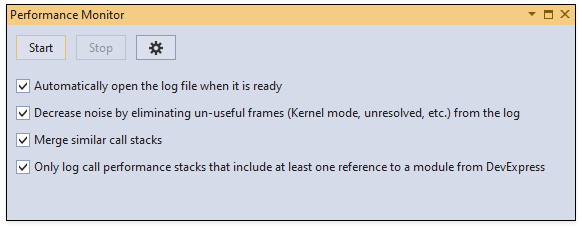
Configure the Performance Monitor options on the IDE | Diagnostic | Performance Monitor options page (optional).

Open the Performance Monitor tool. Use one of the following ways:
Select CodeRush | Windows | Performance Monitor in Visual Studio’s menu.

Note
In Visual Studio 2019, CodeRush menu is placed into a new location - in Visual Studio Extensions menu. You can reposition the CodeRush menu back to the top level of the Visual Studio menu bar in Visual Studio 2019 version 16.4 or later. See the following topic for more information: First Steps.
Open the Shortcuts configuration page (select CodeRush | Shortcuts… in Visual Studio’s menu) and assign a shortcut key for this tool (for example, Ctrl+Shift+Alt+1) to the ShowPerformanceMonitor command. Use this shortcut to open the Performance Monitor tool:

Click Start in the invoked Performance Monitor tool to start logging. Open a problematic project and work until the issue is reproduced.

Click Stop after you reproduced the issue.
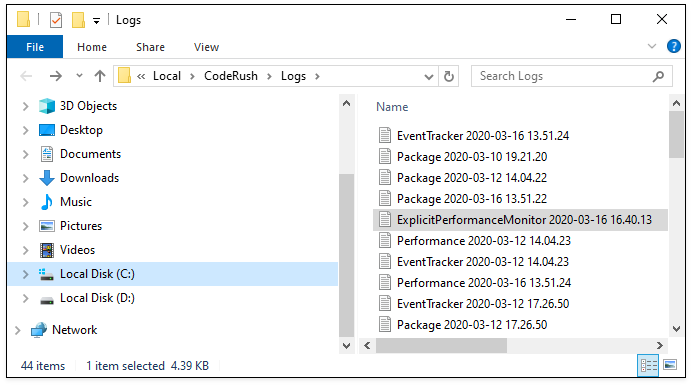
The Performance Monitor tool opens the log file when it is ready. To see the file’s location, invoke the CodeRush | Support | CodeRush Logs… entry from the CodeRush menu and choose the “ExplicitPerformanceMonitor%%%.log” file.
You can send this log file to our Support Center to help our developers analyze the cause of the performance problems.