Display Average Values in Charts
The following tutorial explains how to bind a chart’s constant line to an expression that calculates the average of all displayed values.
Bind a Constant Line to an Expression
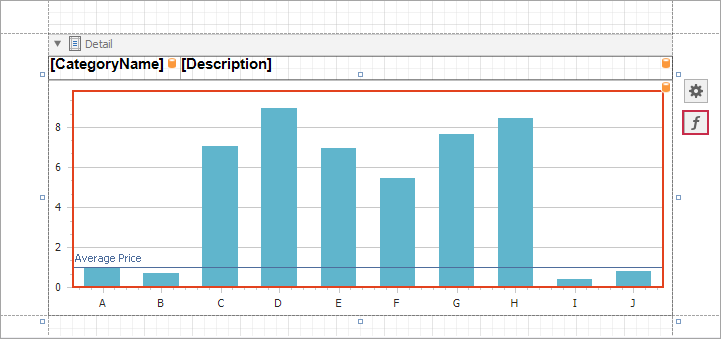
Select the Chart control. The “f” button appears next to the selection. Click this button to invoke the Expression Editor:
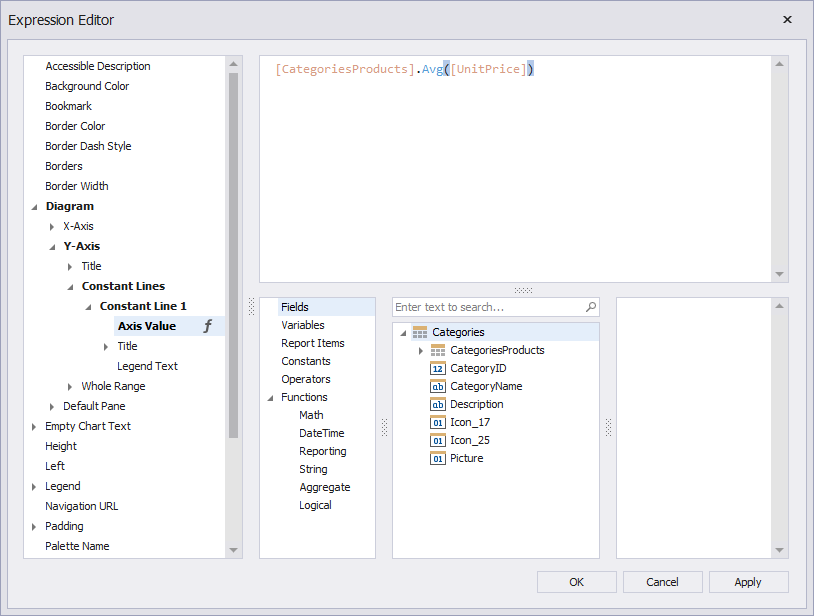
In the invoked editor, specify the following expression for the Axis Value property and click OK.
[CategoriesProducts].Avg([UnitPrice])
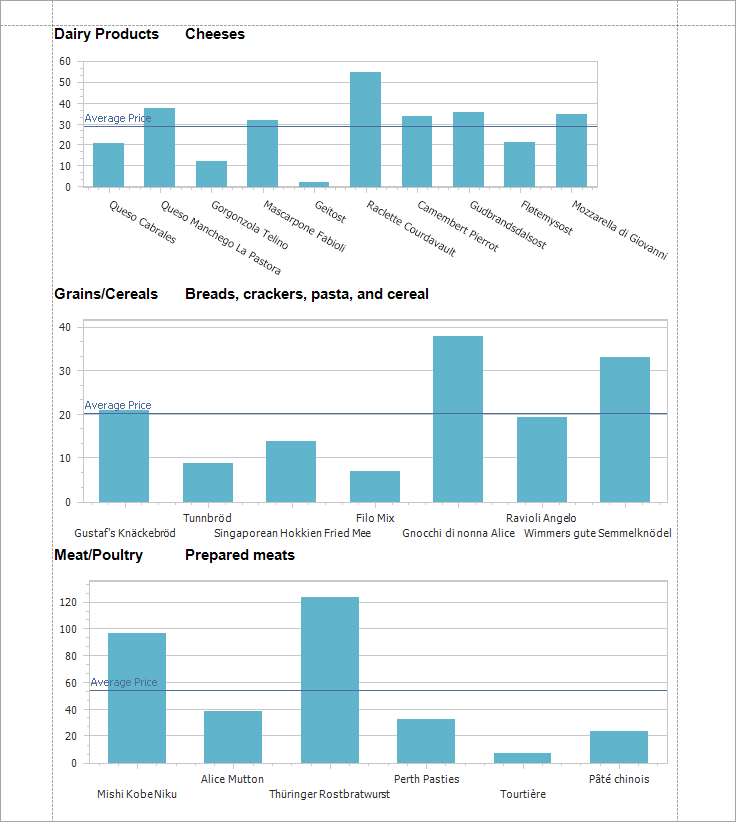
See the Result
Run the application. Constant lines show average product prices in each category.