UI Panels
- 2 minutes to read
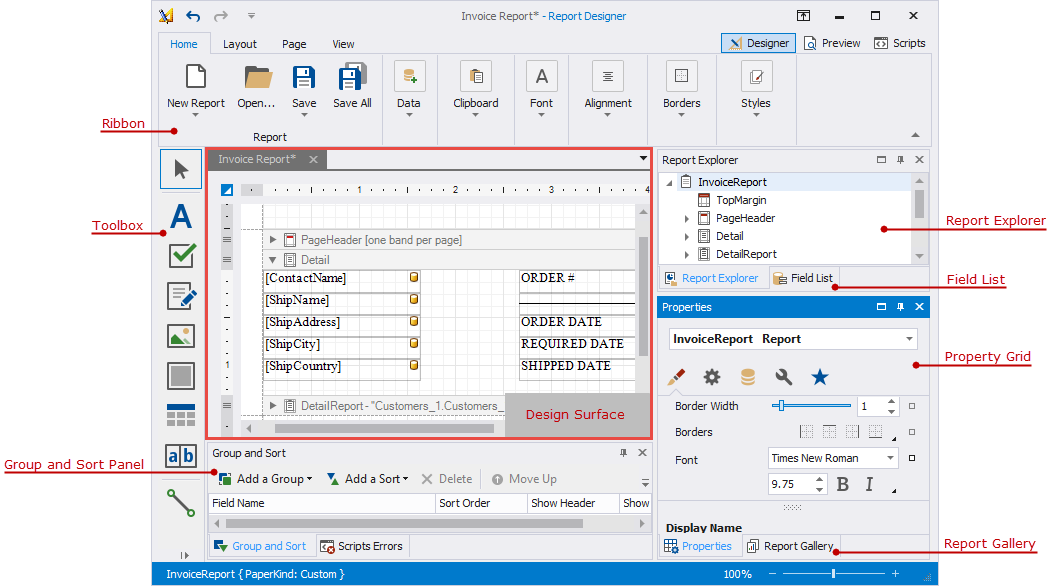
The Report Designer includes the following panels:
-
Contains the main tabs: Home, Layout, Page, and View, and contextual tabs specific to the currently selected report control. The Ribbon control allows you to switch between Designer and Preview, and open the Scripts editor.
-
Displays a tree-like hierarchy of report elements, data sources, and other components, and allows you to manage a collection of visual styles.
-
Displays the data source schema and allows you to manage calculated fields and parameters.
-
Allows you to store and reuse report controls, styles, data sources, and entire report layouts.
-
Allows you to view and modify report settings and report element properties.
Property Grid (Non-Tabbed View)
Allows you to access and customize report/report element settings in a non-tabbed view.
-
Allows you to group and sort data in a report.
-
Displays errors, warnings, and information messages that help users create or enhance a report layout.
-
An area where you can add report controls and edit a report layout.
-
Lists all available report controls. You can drag a control from the toolbox and drop it onto a report design surface.
-
Allows you to configure report design and document generation settings globally at the application level.