CrossTabDataField.SummaryDisplayType Property
Specifies how to display summary values calculated against a data field.
Namespace: DevExpress.XtraReports.UI.CrossTab
Assembly: DevExpress.XtraReports.v20.1.dll
NuGet Packages: DevExpress.Reporting.Core, DevExpress.WindowsDesktop.Reporting.Core
Declaration
[DefaultValue(SummaryDisplayType.Default)]
[SRCategory(ReportStringId.CatData)]
public SummaryDisplayType SummaryDisplayType { get; set; }Property Value
| Type | Default | Description |
|---|---|---|
| SummaryDisplayType | Default | The summary display type. |
Available values:
| Name | Description |
|---|---|
| Default | The calculated summary values “as is”. |
| AbsoluteVariation | The absolute variance between the current value and the previously calculated value for the current field. |
| PercentVariation | The percentage variance between the current value and the previously calculated value for the current field. |
| PercentOfColumn | For data cells, the percentage of the column’s total value; for total cells, the percentage of the column’s grand total value. |
| PercentOfRow | For data cells, the percentage of the row’s total value; for total cells, the percentage of the row’s grand total value. |
| PercentOfColumnGrandTotal | The percent of the summary in the Column Grand Total value. |
| PercentOfRowGrandTotal | The percent of the summary in the Row Grand Total value. |
| PercentOfGrandTotal | The percent of the summary in the Grand Total value. |
| RankInColumnSmallestToLargest | The summary value’s rank in its column, with the smallest value in the column as 1, and each larger value assigned a higher rank. |
| RankInRowSmallestToLargest | The summary value’s rank in its row, with the smallest value in the row as 1, and each larger value assigned a higher rank. |
| RankInColumnLargestToSmallest | The summary value’s rank in its column, with the largest value in the column as 1, and each smaller value assigned a higher rank. |
| RankInRowLargestToSmallest | The summary value’s rank in its row, with the largest value in the row as 1, and each smaller value assigned a higher rank. |
| Index | An index value that reflects the summary value’s importance in its row and column context. This value is calculated as follows: ((Cell Value) x (Grand Total of Grand Totals)) / ((Grand Row Total) x (Grand Column Total)) |
Remarks
The Cross Tab summarizes values of data fields and displays the results “as is” at the intersection of the corresponding row and column.
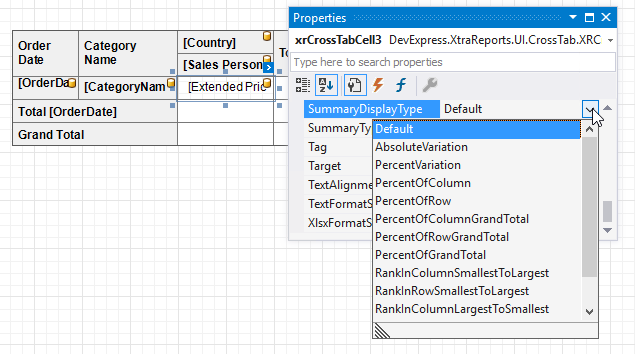
Use the SummaryDisplayType property to display results not “as is”, but in correlation with other cells. To access this property at design time, select a cell bound to the corresponding data field and switch to the Properties window.
The cell’s TextFormatString property allows you to format data accordingly.
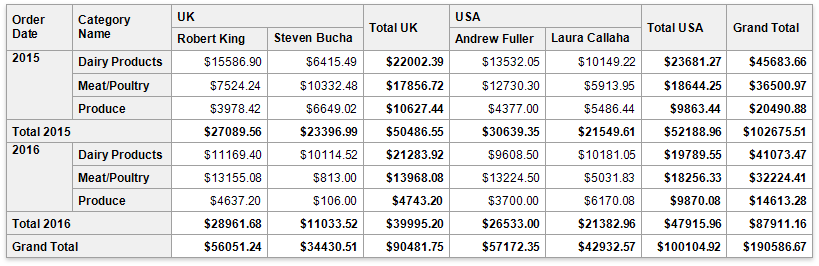
SummaryDisplayType = Default
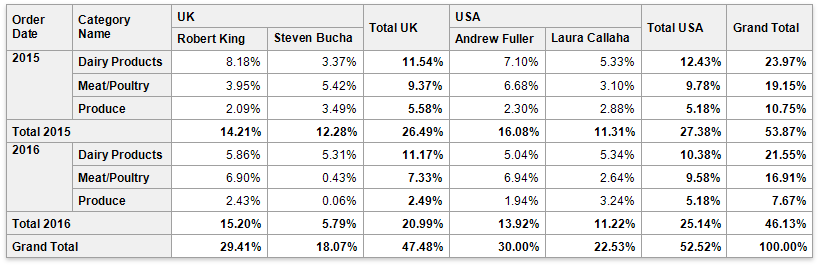
SummaryDisplayType = PercentOfGrandTotal
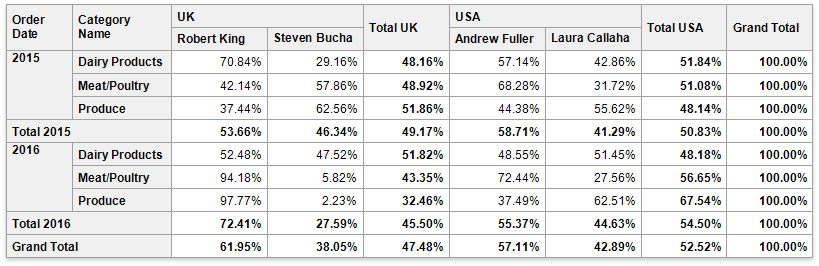
SummaryDisplayType = PercentOfRow
SummaryDisplayType = RankInColumnSmallestToLargest
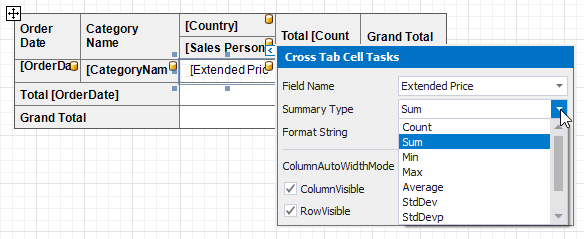
Use the SummaryType property to change the summary function to calculate.