End-User Report Designer with a Ribbon Toolbar
- 2 minutes to read
This document describes the UI elements of a ribbon-based End-User Report Designer form.
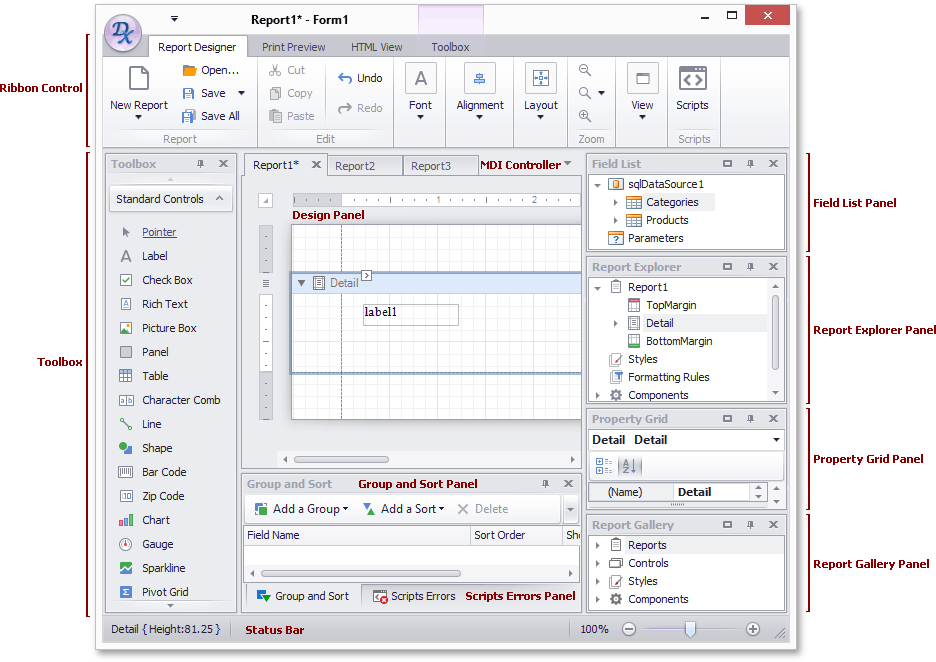
The main elements of a ribbon Report Designer are:
Ribbon Control
Enables you to switch between a report’s Designer, Preview, and HTML View modes and provides commands available in each of these modes. A separate tab provides a Toolbox containing all available report controls.
MDI Controller
Provides the Multiple Document Interface (MDI) to the Report Designer and enables opening multiple reports in each of its Design Panels.
Design Panel
A surface where a report layout is displayed and edited.
The following table describes the Report Designer’s dock panels:
| Panel | Description |
|---|---|
| Field List | Displays the structure of a report’s data source and allows you to maintain a report’s collection of calculated fields and parameters. |
| Report Explorer | Displays a tree-like hierarchy of report elements and allows you to manage a report’s collection of formatting rules and visual styles. |
| Property Grid | Lists all properties available for a selected object (a report or any of its elements). |
| Report Gallery | Stores frequently used report controls, styles, data sources and full report layouts, and allows you to use them across different reports. |
| Group and Sort | Allows you to group and sort data in a report. |
| Scripts Errors | Displays the results of validating report scripts. Clicking an error navigates to a corresponding line in the Scripts editor. |
| Toolbox | Lists all available report controls (similar to the Toolbox tab on the ribbon toolbar). You can drag a control from the toolbox and drop it onto a report’s surface. |
Report Designer also provides a Status Bar displaying information about the element that is currently being hovered by the mouse pointer and tips regarding the current user actions. It also allows you to change a report’s zoom factor.