Reporting Application Diagnostics
- 3 minutes to read
This article describes how to diagnose problems with a web reporting applications.
Client Side Diagnostics
Use your browser’s developer panel to diagnose application problems on the client side. The article uses Google Chrome as an example but you can use the same steps for other browsers.
The flowchart below illustrates the client-side diagnostics process.
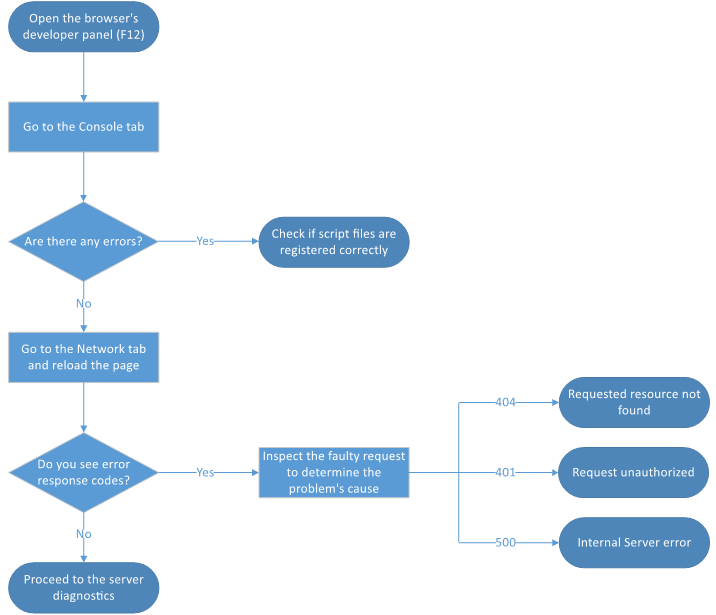
Use the steps below to diagnose problems with a web reporting application on the client:
Open the browser’s developer panel (F12). Go to the Console tab and check if the browser console shows any JavaScript errors.
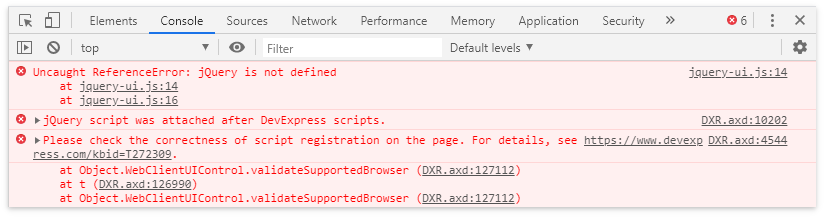
If there are errors, make sure that:
- Script files are registered in the correct order
- There are no duplicate registrations
- There are no conflicts between the scripts
- The version of the DevExpress scripts matches the version of the server-side libraries.
Go to the Network tab, reload the page and inspect the responses from the following server-side handlers:
DXXRDV- Document ViewerDXXRD- Report DesignerDXQB(DXXQBin ASP.NET Core) - Query Builder
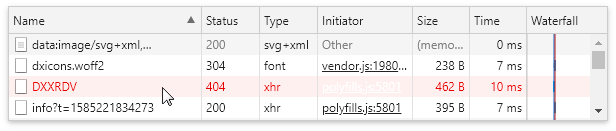
A 4xx or 500 error code means the web server failed due to incorrect server configuration. For more information on the error, select a failed request on the Network tab and open its Preview. If the preview displays no information, make sure custom exception pages are enabled. The table below lists Microsoft documentation articles that describe how to enable custom exception pages for different platforms:
| Platform | Article |
|---|---|
| ASP.Net Web Forms, ASP.Net MVC |
Displaying a Custom Error Page |
| ASP.Net Core | Developer Exception Page |
The table below lists the most common error response codes:
| Code | Description |
|---|---|
| 404 | The server did not find the resource at the specified URL. In a JavaScript reporting application, this means that either the server-side application is configured incorrectly or the host and invokeAction/getDesignerModelAction properties are set incorrectly. |
| 401 | The request was not authorized. The client is not allowed to perform this request. |
| 500 | The request failed due to an internal server error. |
If you cannot diagnose the problem, contact our support team. Save the Network tab’s request information as an HAR file and attach it to your Support Center ticket.
If all requests return 200 (OK) but the problem persists, the server-side code of DevExpress Reporting handled the error. In this case, proceed to the server-side diagnostics.
Server Side Diagnostics
The flowchart below illustrates the server-side diagnostics process.
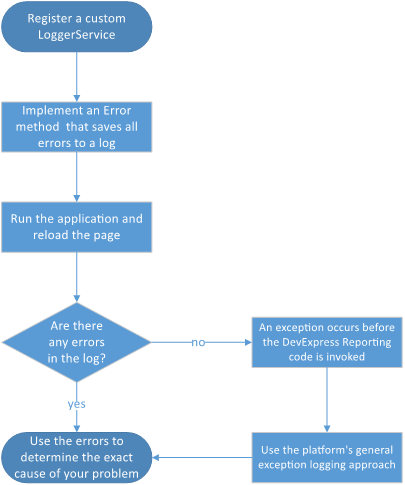
Use the steps below to diagnose a web reporting application on the server:
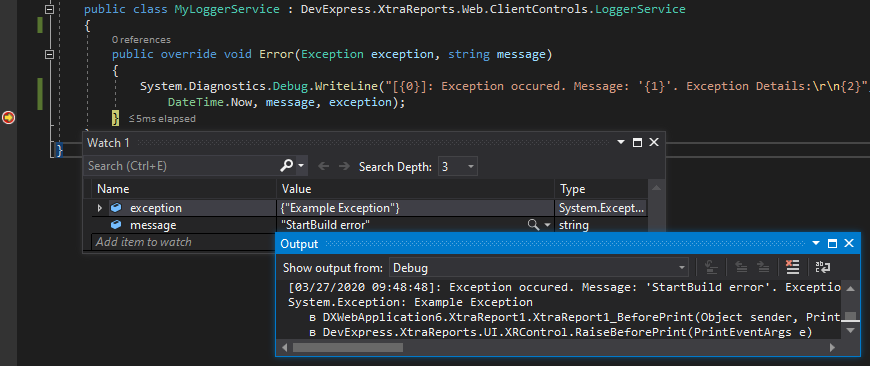
Register a custom LoggerService.
For this service, implement an Error method. In the method’s implementation, save the errors to a log file or database. If a debugger is attached, you can also set a breakpoint and view the incoming errors in the Watch window. Use these errors to locate the problem’s cause.
If you cannot determine the exact cause of the error, send the error message, call stack, and inner exceptions information to the Support Team.
If the LoggerService’s Error method is never called and no errors were logged, make sure that the service is registered correctly. If it is registered correctly, this can mean the exception occurs in your application’s code before the application invokes DevExpress Reporting components. In this case, use your platform’s general exception logging approach:
| Platform | Article |
|---|---|
| ASP.Net Web Forms, ASP.Net MVC |
Adding Error Logging Support |
| ASP.Net Core | Logging in .NET Core and ASP.NET Core |