Axis
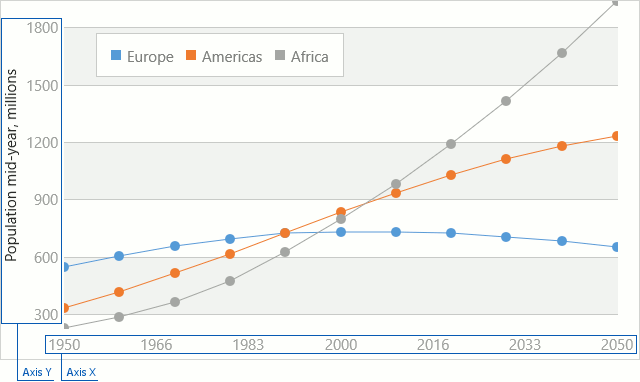
An Axis provides end-users with a visual means for reading and analyzing the data displayed within the chart area. Most charts contain two axes: a numerical axis of values (the Y-axis) and an axis of arguments (the X-axis).
An axis allows you to access and customize the following chart elements: