Series.Summary Property
Gets or sets the series data point summarization settings.
Namespace: DevExpress.Xpf.Charts
Assembly: DevExpress.Xpf.Charts.v21.1.dll
NuGet Package: DevExpress.Wpf.Charts
Declaration
Property Value
| Type | Description |
|---|---|
| Summary | The series data summarization options. |
Remarks
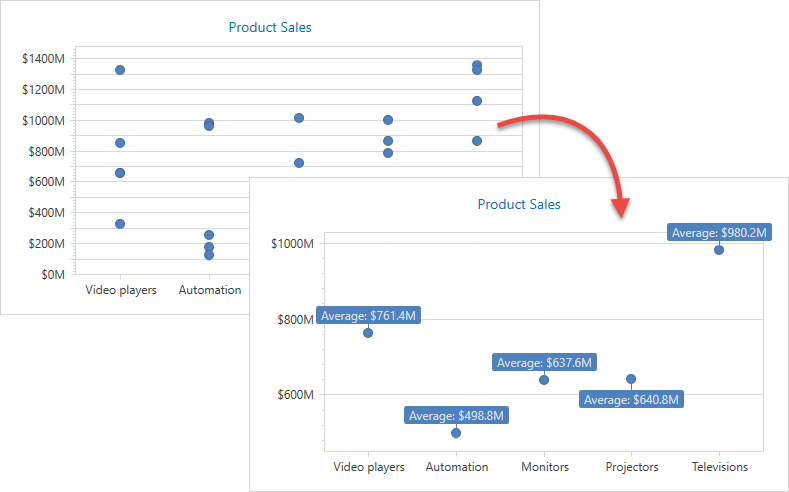
Use the Summary.Function property to specify a function that the Chart Control uses to summarize series data point values.
The following built-in summary functions are available:
- AverageSummaryFunction
- CountSummaryFunction
- MaxSummaryFunction
- MinSummaryFunction
- SumSummaryFunction
Example
The example demonstrates how to apply AverageSummaryFunction to aggregate data points.
Use the following API members to configure the summary function options:
| Member | Description |
|---|---|
Series.Summary |
Gets or sets the series data point summarization settings. |
| Summary | Stores the series data point summarize options. |
| Summary.Function | Specifies the summary function that calculates data point values. |
| AverageSummaryFunction | The summary function that calculates the average of data point values. |
| DataMemberSummaryFunction.ValueDataMember | Gets or sets the data source field that provides data to be aggregated. |
<Window.DataContext>
    <local:ChartViewModel/>
</Window.DataContext>
<Grid>
    <dxc:ChartControl>
        <dxc:XYDiagram2D SeriesItemsSource="{Binding SaleSeries}">
            <dxc:XYDiagram2D.SeriesItemTemplate>
                <DataTemplate>
                    <dxc:PointSeries2D DataSource="{Binding Values}"
                                       ArgumentDataMember="Category"
                                       ValueDataMember="Value">
                        <!-- Configure the summary function options. -->
                        <dxc:PointSeries2D.Summary>
                            <dxc:Summary>
                                <dxc:Summary.Function>
                                    <dxc:AverageSummaryFunction ValueDataMember="Value"/>
                                </dxc:Summary.Function>
                            </dxc:Summary>
                        </dxc:PointSeries2D.Summary>
                        <!--...-->
                        <dxc:PointSeries2D.Label>
                            <dxc:SeriesLabel Visible="True" TextPattern="Average: ${V}M"
                                             dxc:MarkerSeries2D.Angle="90" ResolveOverlappingMode="JustifyAroundPoint"/>
                        </dxc:PointSeries2D.Label>
                    </dxc:PointSeries2D>
                </DataTemplate>
            </dxc:XYDiagram2D.SeriesItemTemplate>
            <dxc:XYDiagram2D.AxisX>
                <dxc:AxisX2D TickmarksMinorVisible="False"/>
            </dxc:XYDiagram2D.AxisX>
            <dxc:XYDiagram2D.AxisY>
                <dxc:AxisY2D Interlaced="False">
                    <dxc:AxisY2D.WholeRange>
                        <dxc:Range dxc:AxisY2D.AlwaysShowZeroLevel="False"/>
                    </dxc:AxisY2D.WholeRange>
                    <dxc:AxisY2D.Label>
                        <dxc:AxisLabel TextPattern="${V}M"/>
                    </dxc:AxisY2D.Label>
                </dxc:AxisY2D>
            </dxc:XYDiagram2D.AxisY>
        </dxc:XYDiagram2D>
        <dxc:ChartControl.Titles>
            <dxc:Title Content="Product Sales" HorizontalAlignment="Center" FontSize="14"/>
        </dxc:ChartControl.Titles>
    </dxc:ChartControl>
</Grid>
Related GitHub Examples
The following code snippet (auto-collected from DevExpress Examples) contains a reference to the Summary property.
Note
The algorithm used to collect these code examples remains a work in progress. Accordingly, the links and snippets below may produce inaccurate results. If you encounter an issue with code examples below, please use the feedback form on this page to report the issue.