HistogramSeriesOptions.UnderflowValue Property
Returns or specifies a custom threshold value for the underflow bin.
Namespace: DevExpress.Spreadsheet.Charts
Assembly: DevExpress.Spreadsheet.v25.1.Core.dll
NuGet Package: DevExpress.Spreadsheet.Core
Declaration
Property Value
| Type | Description |
|---|---|
| Double | The threshold value. |
Property Paths
You can access this nested property as listed below:
| Object Type | Path to UnderflowValue |
|---|---|
| SeriesLayoutOptions |
|
Remarks
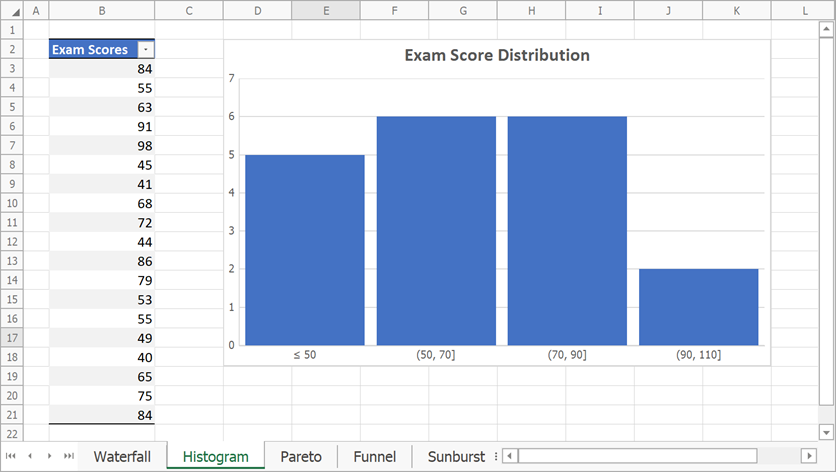
Set the HistogramSeriesOptions.UnderflowType property to Fixed and use the UnderflowValue property to create the underflow bin for all points that are below or equal to the specified value.
The following example demonstrates how to create a histogram chart and display the underflow bin:
// Create a histogram chart and specify its location.
Chart chart = worksheet.Charts.Add(ChartType.Histogram, worksheet["B2:B21"]);
chart.TopLeftCell = worksheet.Cells["D2"];
chart.BottomRightCell = worksheet.Cells["K18"];

// Specify histogram series options.
var options = chart.Series[0].LayoutOptions.Histogram;
options.BinType = HistogramBinType.BinWidth;
options.BinWidth = 20;
// Create the underflow bin for all values
// that are below or equal to 50.
options.UnderflowType = HistogramOverflowType.Fixed;
options.UnderflowValue = 50;

// Specify the gap width.
chart.Series[0].GapWidth = 10;

// Add the chart title.
chart.Title.Visible = true;
chart.Title.SetValue("Exam Score Distribution");
See Also