Pie Chart
- 4 minutes to read
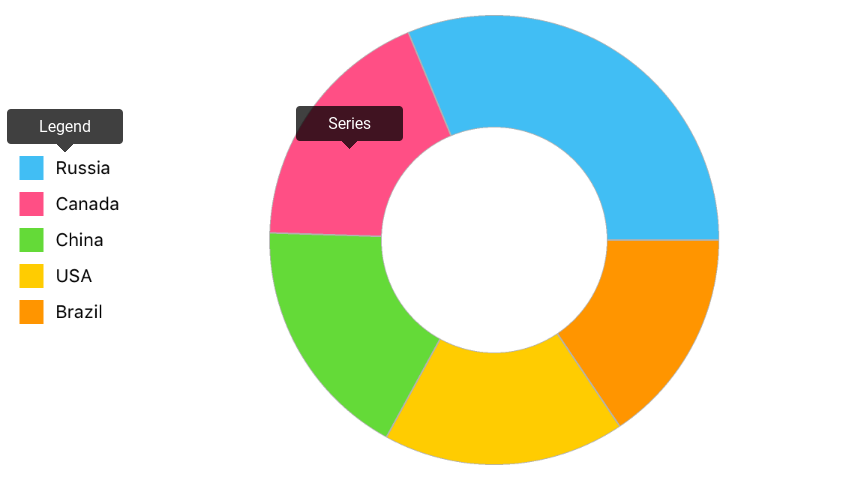
The DevExpress DXPieChart allows you to visualize your data in a Pie (Circular) chart. The image below represents a Pie chart and highlights its major elements:
This guide contains the descriptions of specific operations that can be performed with the DXPieChart.
How to: modify chart series
The Chart visualizes data the series provides. Each series defines data appearance and behavior. Series that are compatible with the Pie Chart inherit the DXPieSeries class.
Note
The chart should be populated with data. Refer to the Series: Data Providing guide for more information.
The following code snippet shows how to add a series to a chart:
DXDonutSeries *series = [[DXDonutSeries alloc] init];
series.data = [CountryAreaData dataWithNames:@[@"Russia", @"Canada", @"China", @"USA", @"Brazil"]
                                    andAreas:@[@17.098, @9.985, @9.597, @9.525, @8.515]];
[self.pieChart addSeries:series];

// Interfaces of the GdpData and Gdp classes.
@interface CountryAreaData <DXPieSeriesData>
    +(instancetype)dataWithNames: (NSArray<NSString *> *)names andAreas: (NSArray<NSNumber *> *)areas;
@end

// implementations of the Gdp and GdpData classes.
@implementation CountryAreaData {
    NSArray<NSString *> *names;
    NSArray<NSNumber *> *areas;
}
+(instancetype)dataWithNames: (NSArray<NSString *> *)names andAreas: (NSArray<NSNumber *> *)areas {
    CountryAreaData *data = [[CountryAreaData alloc] init];
    data->areas = areas;
    data->names = names;
    return data;
}
-(int) getDataCount {
    return (int)areas.count;
}
-(NSString *) getLabelByIndex: (int) index {
    return [names objectAtIndex:index];
}
-(double) getValueByIndex: (int) index {
    return [[areas objectAtIndex:index] doubleValue];
}
@end
The following table contains methods allowing you to obtain, add or remove series of the chart.
| Method | Description |
|---|---|
| DXPieChart.series | Returns all chart’s series. |
| DXPieChart::addSeries: | Adds the specified new series to the chart. |
| DXPieChart::removeSeries: | Removes the specified series from the chart. |
| DXPieChart::removeSeriesAtIndex: | Removes a series at the specified index from the chart. |
How to: configure a chart legend
The Legend identifies series in a chart. The following example demonstrates the basic legend configuration:
DXLegend *legend = [[DXLegend init] alloc];
legend.horizontalPosition = DXLegendVerticalPositionCenter;
legend.verticalPosition = DXLegendVerticalPositionTopOutside;
legend.vertical = false;
self.pieChart.legend = legend;
The table below contains the main symbols configuring the legend.
| Method | Description |
|---|---|
| DXChartBase.legend | Gets or sets a chart’s legend settings. |
| DXLegend | The chart legend options storage. |
Refer to the Legend guide for more information about legend configuration.
How to: change chart appearance
Appearance of all chart elements including the Pie Chart can be changed using styles. The following image demonstrates chart parameters on which chart appearance depends:
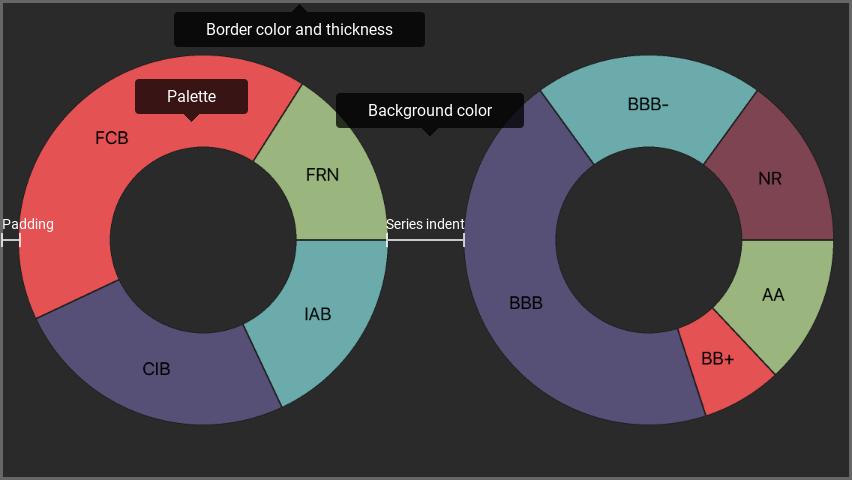
The following code snippet demonstrates how to obtain the image above:
// All sizes are in screen points.
DXPalette *palette = [[DXPalette alloc] init];
palette.colors = @[UIColor.redColor, UIColor.greenColor, UIColor.blueColor, UIColor.yellowColor, UIColor.magentaColor];

DXPieChartStyle *chartStyle = [[DXPieChartStyle alloc] init];
chartStyle.borderColor = UIColor.redColor;
chartStyle.borderThickness = 2;
chartStyle.backgroundColor = [UIColor lightGrayColor];
chartStyle.seriesIndent = 10;
chartStyle.palette = palette;

self.pieChart.style = chartStyle;
The following symbols allow you to configure chart style:
| Symbols | Description |
|---|---|
| DXPieChart.style | Gets or sets the chart’s appearance settings. |
| DXPieChartStyle | The Pie chart style settings storage. |