Debug DevExpress .NET Source Code with PDB Symbols
- 2 minutes to read
DevExpress Universal or DXperience subscription (v22.1+) includes debug symbols that allow you to debug DevExpress .NET Components referenced in your applications.
Follow the steps below to prepare your environment for debugging DevExpress Components.
To install debug symbols, check the Source Code & Symbols option when you install DevExpress Components.
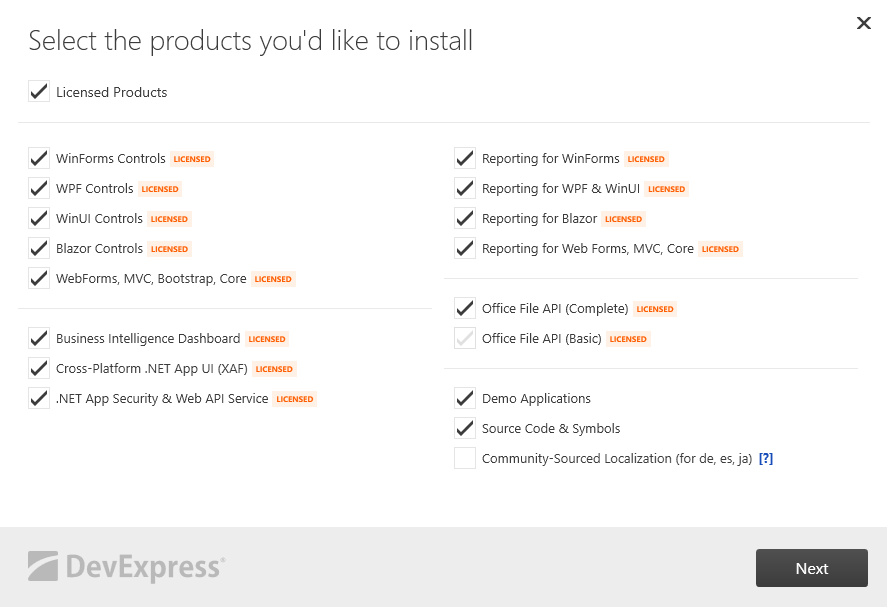
When this option is enabled, the installer installs DevExpress components’ source and symbol files, and registers symbol files in Visual Studio for the current user:

Tip
DevExpress source files are installed in the
C:\Program Files\DevExpress 25.2\Components\Sources\folder.Navigate to Debug | Options and uncheck “Enable Just My Code”.

Specify a path with the DevExpress sources in your solution properties: right-click the solution and navigate to Properties | Common Properties | Debug Source Files. Add a source to the DevExpress Component sources.

Refer to the following Microsoft article for more information: Specify symbol (.pdb) and source files in the Visual Studio debugger
Now, your environment is ready to debug DevExpress components. Set a breakpoint anywhere in DevExpress code and run your application in the Debug configuration. Press F11 to step into DevExpress components source code.
Refer to the following topic for more information: Visual Studio debugger documentation.
Troubleshooting
I cannot inspect a local variable value
Visual Studio may display the following message:
Cannot obtain value of local or argument as it is not available at this instruction pointer, possibly because it has been optimized away.
JIT optimization may have a side effect that does not allow you to watch local variables. Refer to the following topic for more information on debugging optimization: JIT Optimization and Debugging.
To ignore native images compiled with Ngen.exe, you can use scripts listed in the following table:
Visual Studio Version | OS Architecture | |
|---|---|---|
x86 | x64 | |
VS 2010 | ||
VS 2012 | ||
VS 2013 | ||
VS 2015 | ||
VS 2019 | - | |
VS 2022 | - | |
The cursor is positioned on a code line that does not match the call stack
This issue may occur if you have not disabled debugging optimization. Refer to the previous section to fix the issue.