Manage Data Inspector in the WPF Dashboard Control
- 2 minutes to read
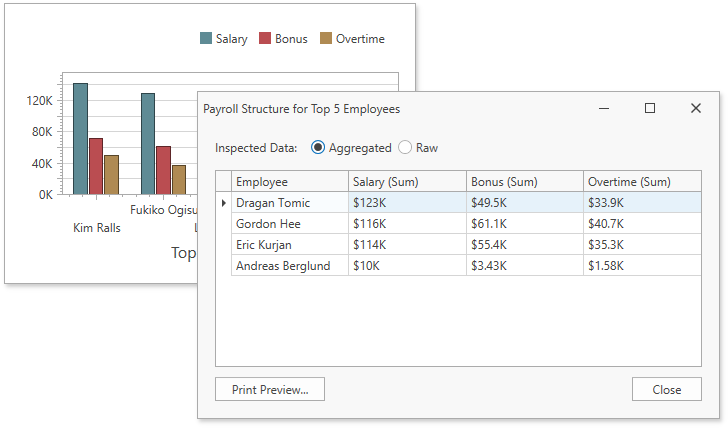
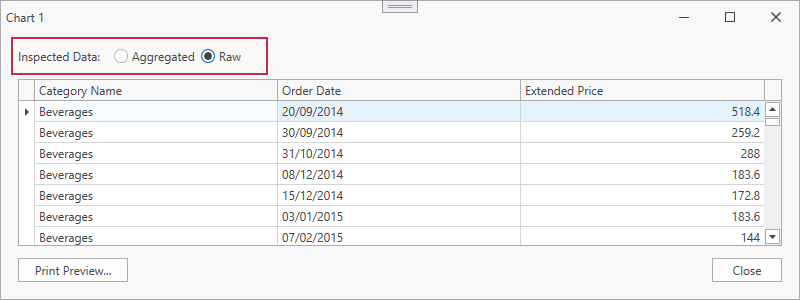
Data Inspector is a dialog window that displays raw or aggregated data. The window can contain one or two grids depending on chosen options. A user can employ the radio group located at the window top to switch between grids.

Aggregated and Raw Data
- Aggregated Data
- Aggregated Data is retrieved from the dashboard item’s data storage that is the MultiDimensionalData object. For more information on how Aggregated Data is displayed in Data Inspector, refer to the following article: Aggregated Data.
- Raw Data
- Raw data is the dashboard item’s underlying data. For more information on how Aggregated Data is displayed in Data Inspector, refer to the following article: Raw Data.
For more information on underlying and displayed data in the WPF Dashboard Control, refer to the following article: Underlying and Displayed Data.
Enable Data Inspector
The Inspect Data button and the corresponding menu item are initially hidden. To show them, set one of the following properties to true depending on the data you want to display:
<dxdash:DashboardControl x:Name="dashboardControl"
                        AllowInspectAggregatedData="True"
                        AllowInspectRawData="True">
To invoke the Data Inspector window in the UI, click the Inspect Data button in the dashboard item caption or select the Inspect Data context menu item:
![]()
When only one property is set to true, the window contains a single grid with raw or aggregated data, depending on what property is enabled. The window caption displays the dashboard item caption text and the inspected item type (raw or aggregated) in parentheses.
When both properties are set to true, the window contains two grids with raw and aggregated data and allows a user to switch between them. The window caption displays the dashboard item caption text.

Export Data
Data Inspector allows you to export data in different formats.
Use the Print Preview dialog to export data in the desired format (Excel, PDF, Image, etc.)
