BI Dashboard Diagnostic Tool
- 4 minutes to read
The BI Dashboard Diagnostic Tool allows you to monitor performance of the main DevExpress BI Dashboard’s data processing operations (such as data load and filter operations). You can estimate execution time for each operation or see the number of code calls for the session period.
The Dashboard Diagnostic Tool UI
The Diagnostic Tool contains a user interface to display and analyze your session data:

The sections below describe the main parts of the Dashboard Diagnostic Tool interface.
Sessions
The Sessions window shows created sessions and allows you to navigate between them.

A session contains all actions executed in a specific time period. When you start a session, the Dashboard Diagnostic Tool monitors the executed code and collects actions for each session event. After you stop the session, the Dashboard Diagnostic Tool generates a log tree. You can inspect logs in the UI or save the resulting report in XML format.
Results
The Results window displays resulting benchmarks.
Benchmarks are used to measure and compare performance. Each benchmark contains the following information:
- Name
- The benchmark name.
- Count
- The number of code calls.
- MSecs
- The code block’s execution time in milliseconds.
The image below displays a log tree for a dashboard load operation. The most time-consuming task of this session is the query execution.

Events
The Events window displays additional information about events that occur during the selected code block’s execution.
The image below shows logs for the DashboardSqldataSource.ExecuteQueryClientMode method. These logs contain the executed query and the number of requested columns and rows.

Manage Sessions in the UI
The main menu contains the following commands:
File

The File menu allows you to save session data in an XML report. Click Open to load an existing report. Select Exit to close the program.
Diagnostic

The Diagnostic menu allows you to manage sessions. Click Start Session to create a new session. Stop Session ends the session and generates a log tree. Click Delete to delete the selected session.
Use Diagnostic Tool in the UI
Run the Diagnostic Tool.
Select Start Session.
Run the code you want to diagnose.
Click Stop Session after the code is compiled. Wait until a log tree is built.
Save the report.
You can analyze the resulting report or send it to the DevExpress Support Center for assistance.
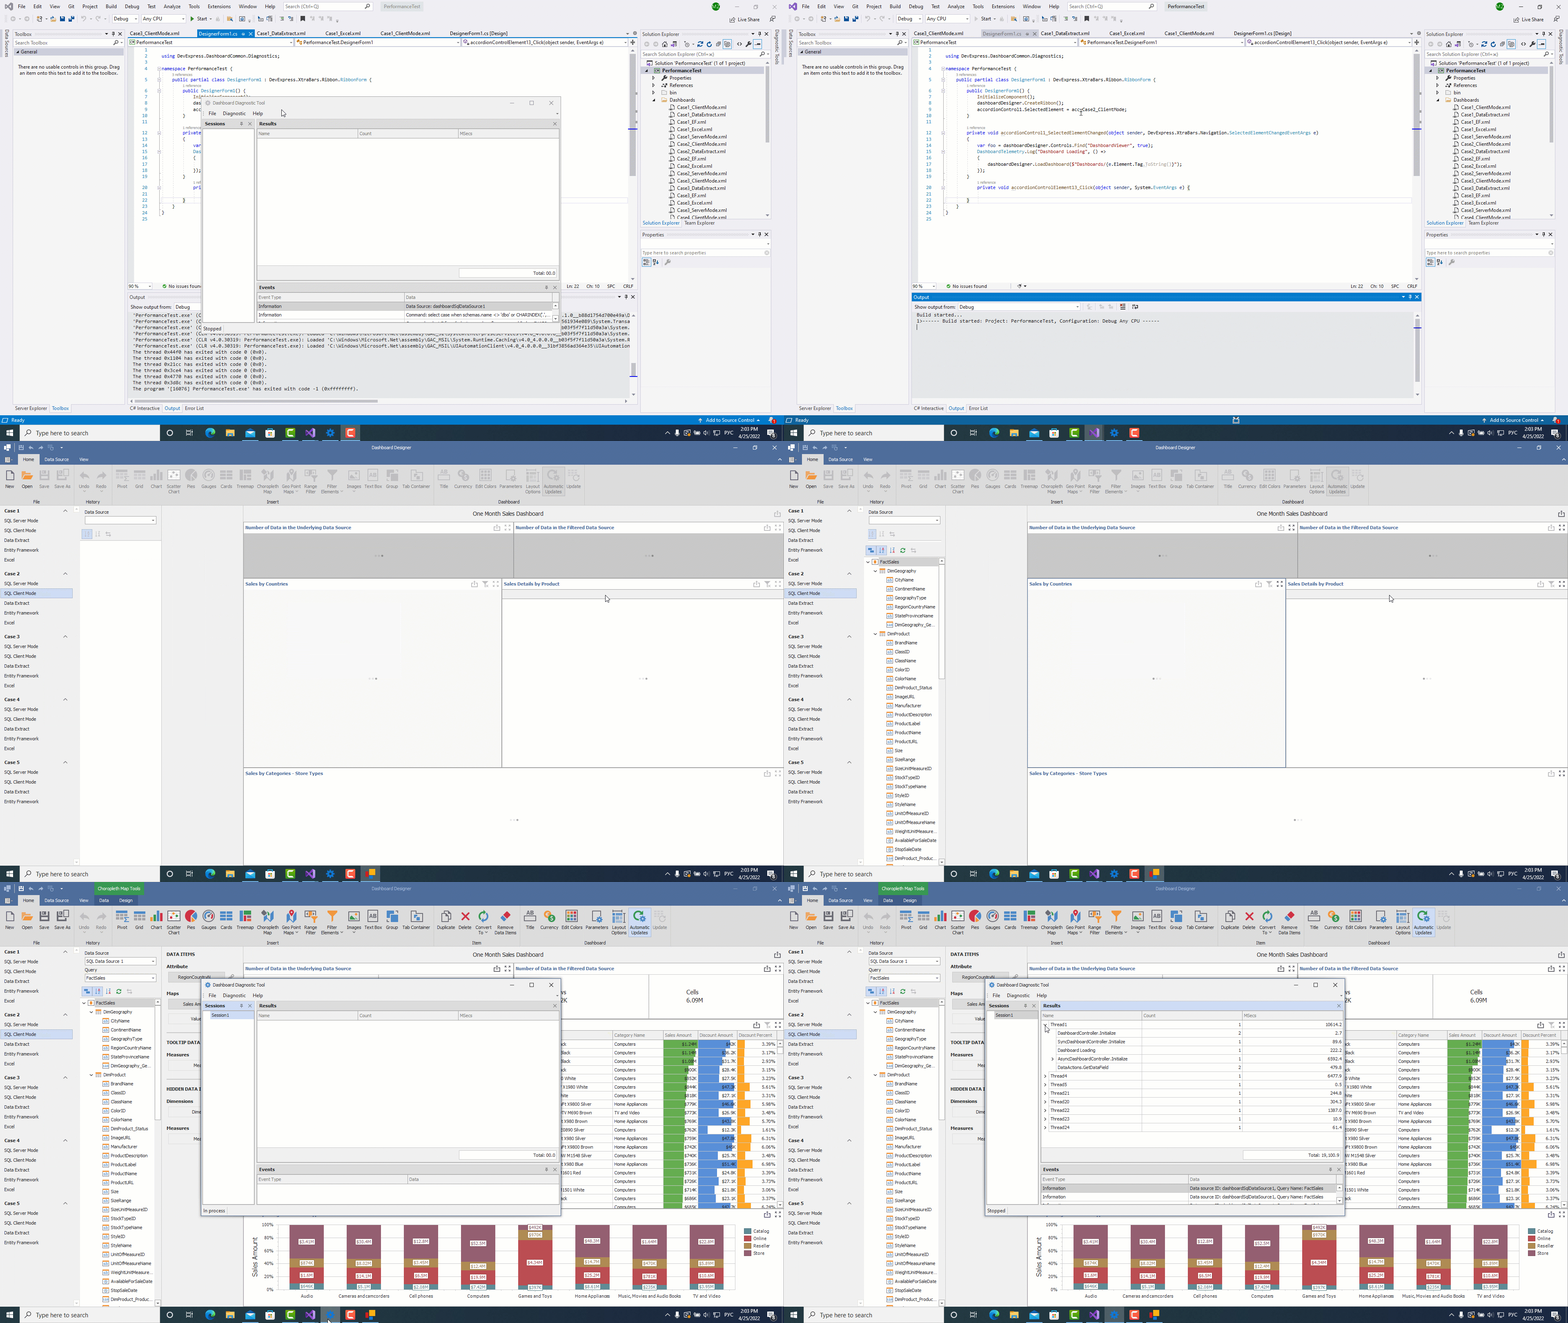
The following GIF image illustrates how to use the Diagnostic Tool to examine the performance of the dashboard load operation:

Use Diagnostic Tool in Code
Download the Dashboard Diagnostic Tool.
Reference
DiagnosticTool.dlland install the Microsoft.Diagnostics.Tracing.TraceEvent package in your dashboard project.Create a
DiagnosticControllerobject.Call the controller’s Start() and Stop() methods to run and finish the Dashboard Diagnostic Tool’s session.
Implement the
IFileControllerinterface and specify the output file path in theTrySaveFilemethod. Pass a new class instance that implementsIFileControllerin the controller’s constructor.To save the resulting report to the specified output path, call the controller’s
Save()method.
The following example shows how to insert the custom Inspect button into the Ribbon in the Dashboard Designer. The button click starts a new diagnostic session. The Dashboard Diagnostic Tool monitors user actions to collects actions for each event of the event session. When you uncheck the button, the session ends and the resulting report is automatically saved to the XML file. You can open the report in the Diagnostic Tool UI.
using DashboardDiagnosticTool;
using DevExpress.DashboardWin;
using DevExpress.Utils.Svg;
using DevExpress.XtraBars;
using DevExpress.XtraBars.Ribbon;
using System.Windows.Forms;

namespace DashboardDiagnostis {
    public partial class DesignerForm1 : DevExpress.XtraBars.Ribbon.RibbonForm {
        BarCheckItem barItem;
        DiagnosticController controller = new DiagnosticController(new FileController());
        public DesignerForm1() {
            InitializeComponent();
            dashboardDesigner.CreateRibbon();
            dashboardDesigner.LoadDashboard(@"Dashboards\dashboard1.xml");
            RibbonControl ribbon = dashboardDesigner.Ribbon;
            RibbonPage page = ribbon.GetDashboardRibbonPage(DashboardBarItemCategory.None, DashboardRibbonPage.Home);
            RibbonPageGroup group = page.GetGroupByName("Performance Diagnostics");
            if (group == null) {
                group = new RibbonPageGroup("Performance Diagnostics") { Name = "Performance Diagnostics" };
                group.AllowTextClipping = false;
                page.Groups.Add(group);
            }
            barItem = AddBarItem("Inspect", svgImageCollection1["inspect"]);
            group.ItemLinks.Add(barItem);
            barItem.ItemClick += barItem_itemclick;
        }
        BarCheckItem AddBarItem(string caption, SvgImage svgImage) {
            BarCheckItem barItem = new BarCheckItem();
            barItem.Caption = caption;
            barItem.Name = "Inspect";
            barItem.ImageOptions.SvgImage = svgImage;
            return barItem;
        }
        private void barItem_itemclick(object sender, ItemClickEventArgs e) {
            foreach (BarItem item in dashboardDesigner.Ribbon.Items) {
                if (item.Name == "Inspect") {
                    updateButton();
                }
            }
        }
        void updateButton() {
            if (barItem.Checked == true) {
                controller.Start();
            }
            else{
                controller.Stop();
                controller.Save();
                MessageBox.Show("Diagnostic is complete");
            }
        }
    }
    public class FileController : IFileController {
        public bool TryOpenFile(out string openName, string fileName = "") {
            openName = "";
            return false;
        }
        public bool TrySaveFile(out string outFileName, string fileName = "") {
            outFileName = @"..\..\Logs\PerformanceLogs.xml";
            return true;
        }
    }
}
Create and Inspect Custom Logs
The DashboardTelemetry class allows the Dashboard Diagnostic Tool to create custom logs for a specific block of code.
Refer to the following class description for information on how to create and inspect custom logs in the BI Dashboard Diagnostic Tool: DashboardTelemetry.