Customize Dashboard Colors
- 3 minutes to read
The Dashboard Designer provides the capability to manage the coloring of dashboard item elements. To learn more, see Coloring.
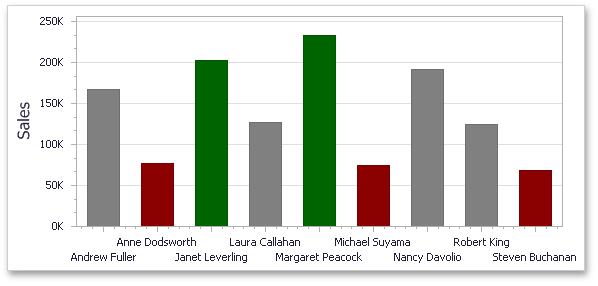
The DashboardViewer allows you to color specified dashboard item elements (for instance, chart series points, pie segments or scatter chart points) at runtime by handling the DashboardViewer.DashboardItemElementCustomColor event. For instance, this can be used to color specified elements based on their values. The image below shows the Chart dashboard item whose bars are colored based on their values: values that exceed 200k are colored in green, values below 100k are colored in red, and values that fall into the range between 100k and 200k are colored in gray.
The DashboardItemElementCustomColorEventArgs class exposes the following settings that allow you to color the required element.
- Use the DashboardItemElementCustomColorEventArgs.DashboardItemName property to obtain the component name of the dashboard item for which the event was raised.
The DashboardItemElementCustomColorEventArgs.TargetElement property returns the axis point tuple that corresponds to the current dashboard item element. Use the AxisPointTuple.Equals method to compare the required axis point tuple with the current AxisPointTuple.
The DashboardItemElementCustomColorEventArgs.Measures property returns measures corresponding to the current dashboard item element. Use the DashboardItemElementCustomColorEventArgs.Data property to create the required tuple (using the MultiDimensionalData.CreateTuple method) and to obtain dashboard item measures (using the MultiDimensionalData.GetMeasures method).
- Use the DashboardItemElementCustomColorEventArgs.Color property to set the color of the current dashboard item element.
Note
By default, the Chart dashboard item colors lines (or fills areas) for the Line/Area series types using the color of the first series point. For these lines/areas, the DashboardItemElementCustomColorEventArgs.TargetElement property returns a tuple that does not contain the AxisPoint on the DashboardDataAxisNames.ChartArgumentAxis.
Example
The following example demonstrates how to color dashboard item elements using the DashboardViewer.DashboardItemElementCustomColor event.
In this example, chart series points, whose values exceed specified thresholds, are colored in green. Chart series points, whose values fall below specified thresholds, are colored in red.
Pie segments, whose contributions in total fall below the specified threshold, are colored in orange.
using System.Drawing;
using DevExpress.XtraEditors;
using DevExpress.DashboardWin;
using DevExpress.DashboardCommon;
using DevExpress.DashboardCommon.ViewerData;

namespace Dashboard_ElementCustomColor {
    public partial class Form1 : XtraForm {
        public Form1() {
            InitializeComponent();
            dashboardViewer1.LoadDashboard(@"..\..\Data\Dashboard.xml");
        }

        private void dashboardViewer1_DashboardItemElementCustomColor(object sender,
            DashboardItemElementCustomColorEventArgs e) {

            MultiDimensionalData data = e.Data;
            AxisPointTuple currentElement = e.TargetElement;

            if (e.DashboardItemName == "chartDashboardItem1") {
                string country =
                    currentElement.GetAxisPoint(DashboardDataAxisNames.ChartSeriesAxis).Value.ToString();
                decimal value = (decimal)(data.GetSlice(currentElement)).GetValue(e.Measures[0]).Value;
                if (country == "UK" && value > 50000 || country == "USA" && value > 100000)
                    e.Color = Color.DarkGreen;
                else
                    e.Color = Color.DarkRed;
            }
            if (e.DashboardItemName == "pieDashboardItem1") {
                decimal value =
                    (decimal)(data.GetSlice(currentElement)).GetValue(data.GetMeasures()[0]).Value;
                if (value < 100000)
                    e.Color = Color.Orange;
            }
        }
    }
}