Coloring
- 6 minutes to read
The Web Dashboard control allows you to manage colors of dashboard item elements, such as chart series points or pie segments. The control associates colors with specific dimension values / measures. Refer to the common Coloring topic for information on which dashboard items support coloring.
Color Schemes Overview
The dashboard provides two ways of coloring dashboard item elements.
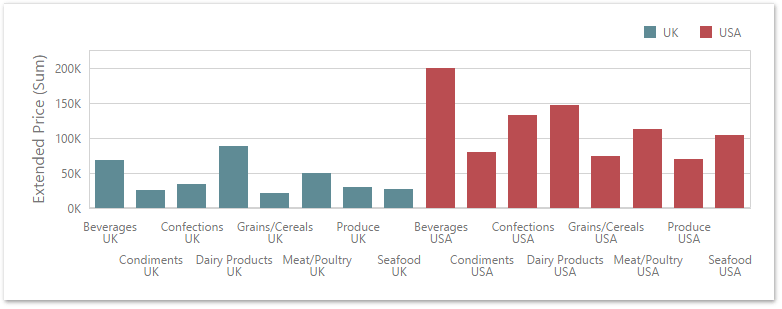
Global color scheme. This color scheme provides consistent colors for identical values across the dashboard. The image below shows the dashboard containing Pie and Chart dashboard items. Pie segments and chart series points corresponding to Beverages, Condiments and Confections dimension values are colored with identical colors from the default palette.
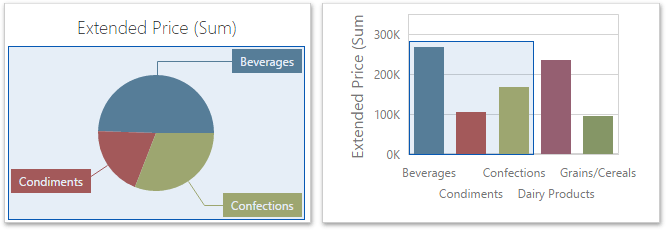
For a global color scheme, the dashboard reserves automatically generated colors for specific values regardless of the filter state.
Local color scheme. This color scheme provides an independent set of colors for each dashboard item.
For a local color scheme, the dashboard reassigns palette colors when the filter state is changed.
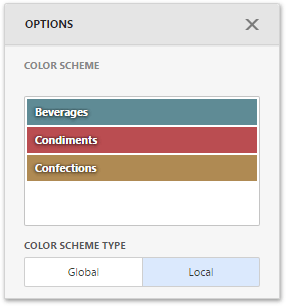
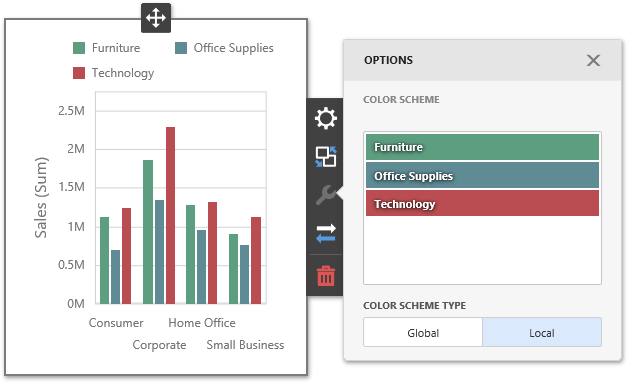
To select a type of coloring dashboard item elements, open the dashboard item menu, go to the Color Scheme section and use the Color Scheme Type option.
Tip
Local colorization operates faster because the control does not request all possible colors and requests only colors used in the current item.
Color Measures and Dimensions
You can use predefined coloring modes to manage the coloring of individual dimensions or all dashboard item measures.
The following coloring settings are available.
| Coloring Mode | Description |
|---|---|
| Auto | Dimension values/measures are colored by default. For more information about default coloring of the specific dashboard’s elements, see the Dashboard Item Coloring Specific section. |
| On | Dimension values/measures are colored by different hues. |
| Off | Dimension values/measures are colored with the same color. |
You can configure coloring in two ways.
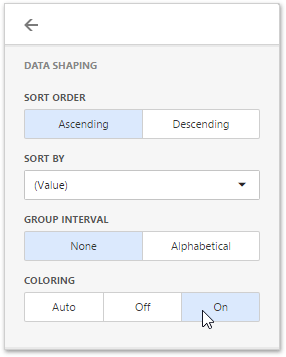
To specify the coloring mode for the specific measure/dimension, open the data item menu and go to Data Shaping section. Use the Coloring option to specify coloring mode of this data item.
To see a list of all measures/dimensions for which you can specify coloring mode, open the dashboard item’s Options menu and go to the Coloring section.
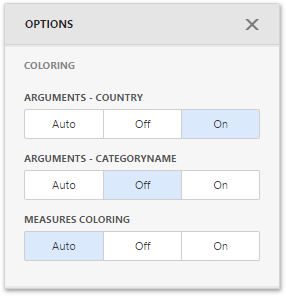
For example, the image below shows the Chart dashboard item whose Country dimension is colored by different hues…
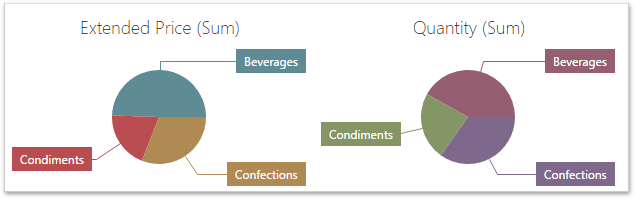
…and this image shows the Pie dashboard item whose measures are colored by different hues.
Note
If you enable coloring by different hues for several dimensions/measures, all combinations of dimension values/measures are colored with different colors from the default palette.
Dashboard Item Coloring Specific
The following table contains the information about the default coloring dashboard items’ behavior.
| Item’s Name | Coloring Specific |
|---|---|
| Chart | The Chart colors different measures and series dimensions by hue. |
| Scatter Chart | The Scatter Chart does not color its arguments. |
| Pies | If the Pie dashboard item contains measures (the Values section) and series dimensions (the Series section), only values corresponding to different measures are colored by hue. If the Pie dashboard item contains arguments (the Arguments section), different argument values are colored by hue. |
| Choropleth Map | The Choropleth Map automatically selects palette and scale settings to color map shapes. |
| Bubble Map | The Bubble Map automatically selects palette and scale settings used to color bubbles depending on the provided values. |
| Pie Map | The Pie Map allows you to manage the coloring of segments corresponding to various dimension values/measures. |
| Range Filter | The Range Filter colors different measures and series dimensions by hue. |
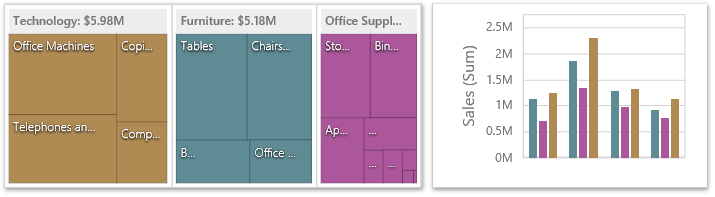
| Treemap | If the Treemap contains only measures (the Values section), values corresponding to different measures are colored by different hues. If the Treemap contains arguments (the Arguments section), values corresponding to the first argument are colored by different hues. |
See the Color Measures and Dimensions section for information on how to change the default coloring behavior.
Customize Color Palettes in the Dashboard Item Menu
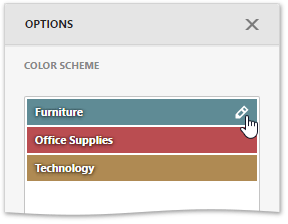
Use the Color Scheme section of the dashboard item Options menu to customize colors of the specific palette. To edit the color scheme, click the Edit button (the ![]() icon) of the corresponding color.
icon) of the corresponding color.
Then, pick any color in the RGB color model of the invoked color picker and click Confirm to change the color.
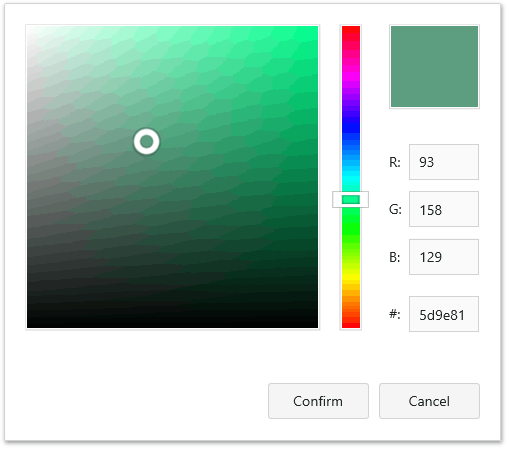
A new color scheme is applied to the dashboard item(s).
Note
By default, the dashboard colors dimension values/measures use the default palette that contains 20 unique colors. If necessary, you can substitute the default palette by handling one of the following events.
Customize Color Palettes in the Color Schemes Page
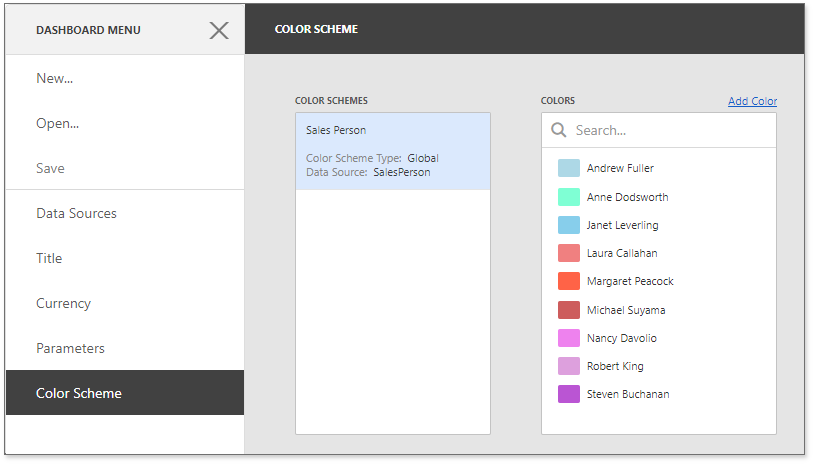
The Color Scheme page of the dashboard menu allows you to customize color tables by editing and adding colors.
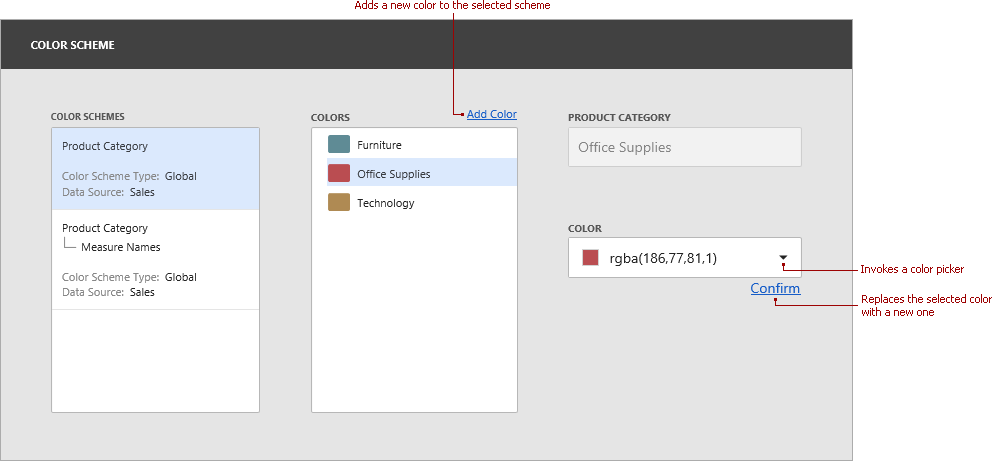
Edit colors. You can reassign a color in the selected color table. For this, select one of the available schemes in the Color Schemes pane and click the color in the Colors pane to provide access to the Color combo box.
Clicking the Color dropdown button invokes a color picker where you can specify a new color.
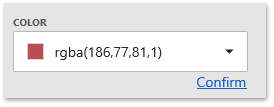
Click Confirm to change the automatically assigned color for the selected value and update the current color scheme.
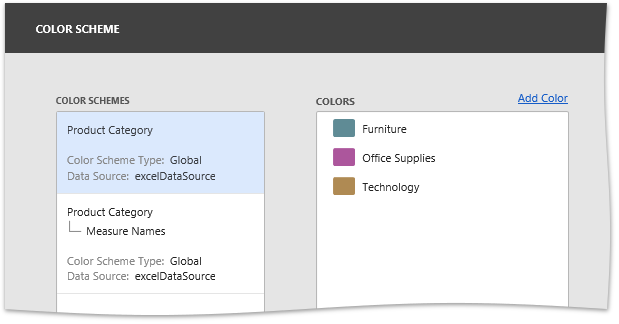
The image below shows the updated color table.
Add colors. The Color Scheme page allows you to add a new value with the specified color to the selected color scheme. To do this, use the Add color button.
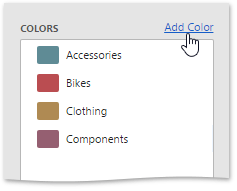
Specify the dimension value of the added color or select the measures. This creates a new value whose color can be specified as described in the Edit colors section.
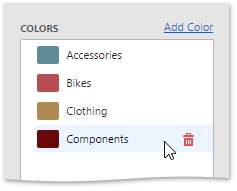
Click Remove (the
 icon) to remove colors.
Customize Color Palettes in Code
DevExpress Dashboard uses a set of 20 unique colors from the default palette to color dashboard item elements (for instance, Chart series points or Pie segments). You can use the static DashboardPalette.Default field to access the default palette.
Handle the ASPxDashboard.CustomPalette / DashboardConfigurator.CustomPalette event to create your own palette providing custom colors. To do this, create and initialize the DashboardPalette class instance and assign the resulting object to the CustomPaletteWebEventArgs.Palette event parameter:
using DevExpress.DashboardCommon;
using DevExpress.DashboardWeb;
using System.Collections.Generic;
using System.Drawing;

// ...

protected void ASPxDashboard1_CustomPalette(object sender, CustomPaletteWebEventArgs e) {
    List<Color> customColors = new List<Color>();
    customColors.Add(Color.LightBlue);
    customColors.Add(Color.Aquamarine);
    customColors.Add(Color.SkyBlue);
    customColors.Add(Color.LightCoral);
    customColors.Add(Color.Tomato);
    customColors.Add(Color.IndianRed);
    customColors.Add(Color.Violet);
    customColors.Add(Color.Plum);
    customColors.Add(Color.MediumOrchid);

    e.Palette = new DashboardPalette(customColors);
}