PivotGridOptionsChartDataSource Class
Contains options controlling the display of the PivotGrid’s data in a ChartControl.
Namespace: DevExpress.XtraPivotGrid
Assembly: DevExpress.PivotGrid.v19.2.Core.dll
Declaration
Related API Members
The following members return PivotGridOptionsChartDataSource objects:
| Library | Related API Members |
|---|---|
| WinForms Controls | PivotGridControl.OptionsChartDataSource |
| Reporting | XRPivotGrid.OptionsChartDataSource |
Remarks
A PivotGrid control’s data can be visualized in a ChartControl. Use the PivotGridControl.OptionsChartDataSource property to access the options controlling the display of data in a chart control.
The main options provided by the PivotGridOptionsChartDataSource class are:
- PivotGridOptionsChartDataSourceBase.ProvideDataByColumns - specifies whether series in a chart control are created based on PivotGrid columns or rows.
- PivotGridOptionsChartDataSource.SelectionOnly - specifies whether the chart control must display all the PivotGrid control’s data or only the selected cells. If this option is set to true, changing selection in a PivotGrid control automatically updates the chart control.
- PivotGridOptionsChartDataSourceBase.ProvideColumnTotals and PivotGridOptionsChartDataSourceBase.ProvideRowTotals - specify whether data of automatic totals must be displayed in a chart control;
- PivotGridOptionsChartDataSourceBase.ProvideColumnGrandTotals and PivotGridOptionsChartDataSourceBase.ProvideRowGrandTotals - specify whether data of automatic grand totals must be displayed in a chart control;
- PivotGridOptionsChartDataSourceBase.ProvideColumnCustomTotals and PivotGridOptionsChartDataSourceBase.ProvideRowCustomTotals - specify whether data of custom totals must be displayed in a chart control;
To display a PivotGrid’s data in a chart control, set the chart control’s properties as follows:
- the DataSource property to the PivotGrid object;
- the SeriesDataMember property to the “Series” string;
- the SeriesTemplate.ArgumentDataMember property to the “Arguments” string;
- to the SeriesTemplate.ValueDataMembers collection add an array containing the “Values” string;
Example
The following code shows how to display a Pivot Grid Control’s data in a ChartControl.
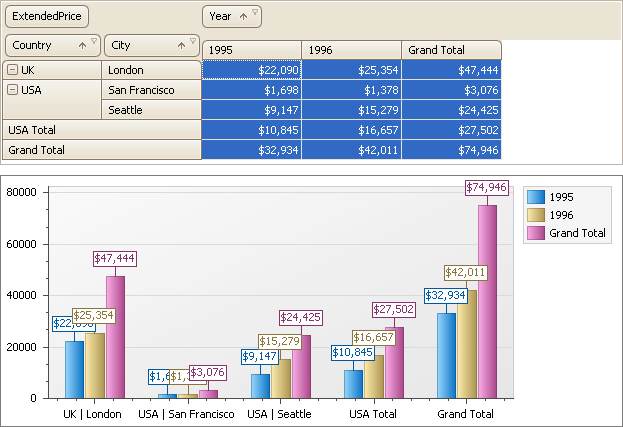
If the PivotGridOptionsChartDataSourceBase.ProvideDataByColumns property is set to true, series in the chart control are created based on PivotGrid columns:
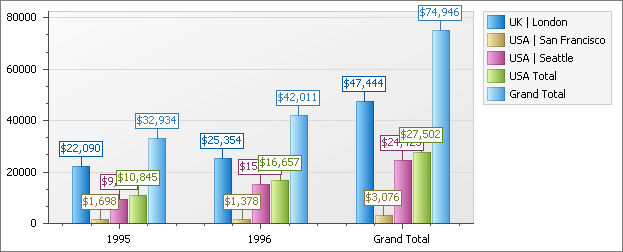
If the PivotGridOptionsChartDataSourceBase.ProvideDataByColumns property is set to false, series in the chart control are created based on PivotGrid rows:
using DevExpress.XtraCharts;

chartControl1.DataSource = pivotGridControl1;
chartControl1.SeriesDataMember = "Series";
chartControl1.SeriesTemplate.ArgumentDataMember = "Arguments";
chartControl1.SeriesTemplate.ValueDataMembers.AddRange(new string[] { "Values" });
// Format display values.
chartControl1.SeriesTemplate.PointOptions.ValueNumericOptions.Format = NumericFormat.Currency;
chartControl1.SeriesTemplate.PointOptions.ValueNumericOptions.Precision = 0;

pivotGridControl1.OptionsChartDataSource.ProvideDataByColumns = true;
//see image 1
//...
pivotGridControl1.OptionsChartDataSource.ProvideDataByColumns = false;
//see image 2
//...