SeriesPointFilter.Condition Property
Gets or sets the requirement to meet when filtering the series points.
Namespace: DevExpress.XtraCharts
Assembly: DevExpress.XtraCharts.v22.2.dll
NuGet Package: DevExpress.Charts
Declaration
Property Value
| Type | Description |
|---|---|
| DataFilterCondition | A DataFilterCondition enumeration member representing a logical operator. |
Available values:
| Name | Description |
|---|---|
| Equal | Specifies the “equal to” comparison operator. |
| GreaterThan | Specifies the “greater than” comparison operator. |
| GreaterThanOrEqual | Specifies the “greater than or equal to” comparison operator. |
| LessThan | Specifies the “less than” comparison operator. |
| LessThanOrEqual | Specifies the “less than or equal to” comparison operator. |
| NotEqual | Specifies the “not equal to” comparison operator. |
Remarks
Use the Condition property to specify a condition that should be satisfied to filter series points. The Condition property represents the logical operator used to compare the values of the SeriesPointFilter.Key with the filter value specified by the SeriesPointFilter.Value property. These filters can be applied to populate the ExplodedSeriesPointCollection - the collection of points to be displayed as exploded slices in the Pie and Donut Series Views.
Example
The following example shows how to create a Pie chart at runtime.
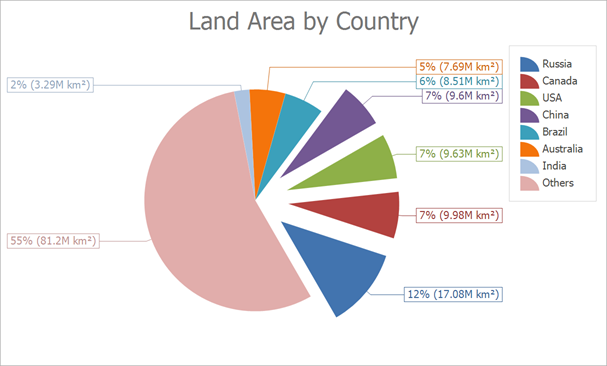
The Chart Control uses the Simple Diagram to display pies. Cast the ChartControl.Diagram property to the SimpleDiagram type to access diagram settings. The Chart Control determines the diagram type based on the series that is added first. We recommend that you access the diagram to configure its settings after at least one series is added to the chart.
To access pie series view settings, cast the SeriesBase.View property to the PieSeriesView type.
using System;
using System.Collections.Generic;
using System.Windows.Forms;
using DevExpress.XtraCharts;

namespace Series_PieChart {
    public partial class Form1 : DevExpress.XtraEditors.XtraForm {
        public Form1() {
            InitializeComponent();
        }
        private void Form1_Load(object sender, EventArgs e) {
            // Create an empty chart.
            ChartControl pieChart = new ChartControl();

            pieChart.Titles.Add(new ChartTitle() { Text = "Land Area by Country" });

            // Create a pie series.
            Series series1 = new Series("Land Area by Country", ViewType.Pie);

            // Bind the series to data.
            series1.DataSource = DataPoint.GetDataPoints();
            series1.ArgumentDataMember = "Argument";
            series1.ValueDataMembers.AddRange(new string[] { "Value" });

            // Add the series to the chart.
            pieChart.Series.Add(series1);

            // Access diagram settings.
            SimpleDiagram diagram = (SimpleDiagram)pieChart.Diagram;
            diagram.Margins.All = 10;

            // Format the the series labels.
            series1.Label.TextPattern = "{VP:p0} ({V:.##}M km²)";

            // Format the series legend items.
            series1.LegendTextPattern = "{A}";

            // Adjust the position of series labels.
            ((PieSeriesLabel)series1.Label).Position = PieSeriesLabelPosition.TwoColumns;

            // Detect overlapping of series labels.
            ((PieSeriesLabel)series1.Label).ResolveOverlappingMode = ResolveOverlappingMode.Default;

            // Access the view-type-specific options of the series.
            PieSeriesView myView = (PieSeriesView)series1.View;

            // Specify the pie rotation.
            myView.Rotation = -60;

            // Specify a data filter to explode points.
            myView.ExplodedPointsFilters.Add(new SeriesPointFilter(SeriesPointKey.Value_1,
                DataFilterCondition.GreaterThanOrEqual, 9));
            myView.ExplodedPointsFilters.Add(new SeriesPointFilter(SeriesPointKey.Argument,
                DataFilterCondition.NotEqual, "Others"));
            myView.ExplodeMode = PieExplodeMode.UseFilters;
            myView.ExplodedDistancePercentage = 30;
            myView.RuntimeExploding = true;

            // Customize the legend.
            pieChart.Legend.Visibility = DevExpress.Utils.DefaultBoolean.True;

            // Add the chart to the form.
            pieChart.Dock = DockStyle.Fill;
            this.Controls.Add(pieChart);
        }
    }
    public class DataPoint {
        public string Argument { get; set; }
        public double Value { get; set; }

        public static List<DataPoint> GetDataPoints() {
            return new List<DataPoint> {
                    new DataPoint { Argument = "Russia",    Value = 17.0752},
                    new DataPoint { Argument = "Canada",    Value = 9.98467},
                    new DataPoint { Argument = "USA",       Value = 9.63142},
                    new DataPoint { Argument = "China",     Value = 9.59696},
                    new DataPoint { Argument = "Brazil",    Value = 8.511965},
                    new DataPoint { Argument = "Australia", Value = 7.68685},
                    new DataPoint { Argument = "India",     Value = 3.28759},
                    new DataPoint { Argument = "Others",    Value = 81.2}
                };
        }
    }
}