PieSeriesViewBase.ExplodeMode Property
Gets or sets the value used to specify which series should be represented as slices offset from the pie.
Namespace: DevExpress.XtraCharts
Assembly: DevExpress.XtraCharts.v22.2.dll
NuGet Package: DevExpress.Charts
Declaration
[XtraChartsLocalizableCategory(XtraChartsCategory.Behavior)]
public PieExplodeMode ExplodeMode { get; set; }Property Value
| Type | Description |
|---|---|
| PieExplodeMode | A PieExplodeMode enumeration member, that determines the exploded series. |
Available values:
| Name | Description |
|---|---|
| None | No pie slices are exploded. |
| All | All pie slices are exploded. |
| MinValue | A pie slice for the series point with the minimum value (represented as the first item in a series point’s SeriesPoint.Values collection) is exploded. If there are several pie slices with the same minimum value, all of them are exploded. |
| MaxValue | A pie slice for the series point with the maximum value (represented as the first item in a series point’s SeriesPoint.Values collection) is exploded. If there are several pie slices with the same maximum value, all of them are exploded. |
| UsePoints | Pie slices to be exploded are contained in the collection of series points returned by the PieSeriesViewBase.ExplodedPoints property. |
| UseFilters | Pie slices to be exploded are specified via the collection of filters returned by the PieSeriesViewBase.ExplodedPointsFilters property. |
| Others | A pie slice showing the Others category is exploded. Note that this category is displayed if the TopNOptions.Enabled and the TopNOptions.ShowOthers properties are set to true. |
Remarks
For more information, refer to the PieExplodeMode topic.
Example
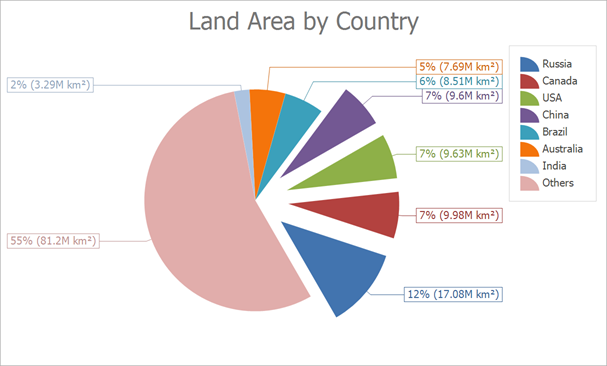
The following example shows how to create a Pie chart at runtime.
The Chart Control uses the Simple Diagram to display pies. Cast the ChartControl.Diagram property to the SimpleDiagram type to access diagram settings. The Chart Control determines the diagram type based on the series that is added first. We recommend that you access the diagram to configure its settings after at least one series is added to the chart.
To access pie series view settings, cast the SeriesBase.View property to the PieSeriesView type.
using System;
using System.Collections.Generic;
using System.Windows.Forms;
using DevExpress.XtraCharts;

namespace Series_PieChart {
    public partial class Form1 : DevExpress.XtraEditors.XtraForm {
        public Form1() {
            InitializeComponent();
        }
        private void Form1_Load(object sender, EventArgs e) {
            // Create an empty chart.
            ChartControl pieChart = new ChartControl();

            pieChart.Titles.Add(new ChartTitle() { Text = "Land Area by Country" });

            // Create a pie series.
            Series series1 = new Series("Land Area by Country", ViewType.Pie);

            // Bind the series to data.
            series1.DataSource = DataPoint.GetDataPoints();
            series1.ArgumentDataMember = "Argument";
            series1.ValueDataMembers.AddRange(new string[] { "Value" });

            // Add the series to the chart.
            pieChart.Series.Add(series1);

            // Access diagram settings.
            SimpleDiagram diagram = (SimpleDiagram)pieChart.Diagram;
            diagram.Margins.All = 10;

            // Format the the series labels.
            series1.Label.TextPattern = "{VP:p0} ({V:.##}M km²)";

            // Format the series legend items.
            series1.LegendTextPattern = "{A}";

            // Adjust the position of series labels.
            ((PieSeriesLabel)series1.Label).Position = PieSeriesLabelPosition.TwoColumns;

            // Detect overlapping of series labels.
            ((PieSeriesLabel)series1.Label).ResolveOverlappingMode = ResolveOverlappingMode.Default;

            // Access the view-type-specific options of the series.
            PieSeriesView myView = (PieSeriesView)series1.View;

            // Specify the pie rotation.
            myView.Rotation = -60;

            // Specify a data filter to explode points.
            myView.ExplodedPointsFilters.Add(new SeriesPointFilter(SeriesPointKey.Value_1,
                DataFilterCondition.GreaterThanOrEqual, 9));
            myView.ExplodedPointsFilters.Add(new SeriesPointFilter(SeriesPointKey.Argument,
                DataFilterCondition.NotEqual, "Others"));
            myView.ExplodeMode = PieExplodeMode.UseFilters;
            myView.ExplodedDistancePercentage = 30;
            myView.RuntimeExploding = true;

            // Customize the legend.
            pieChart.Legend.Visibility = DevExpress.Utils.DefaultBoolean.True;

            // Add the chart to the form.
            pieChart.Dock = DockStyle.Fill;
            this.Controls.Add(pieChart);
        }
    }
    public class DataPoint {
        public string Argument { get; set; }
        public double Value { get; set; }

        public static List<DataPoint> GetDataPoints() {
            return new List<DataPoint> {
                    new DataPoint { Argument = "Russia",    Value = 17.0752},
                    new DataPoint { Argument = "Canada",    Value = 9.98467},
                    new DataPoint { Argument = "USA",       Value = 9.63142},
                    new DataPoint { Argument = "China",     Value = 9.59696},
                    new DataPoint { Argument = "Brazil",    Value = 8.511965},
                    new DataPoint { Argument = "Australia", Value = 7.68685},
                    new DataPoint { Argument = "India",     Value = 3.28759},
                    new DataPoint { Argument = "Others",    Value = 81.2}
                };
        }
    }
}
Related GitHub Examples
The following code snippet (auto-collected from DevExpress Examples) contains a reference to the ExplodeMode property.
Note
The algorithm used to collect these code examples remains a work in progress. Accordingly, the links and snippets below may produce inaccurate results. If you encounter an issue with code examples below, please use the feedback form on this page to report the issue.