Debugging Assistance
- 2 minutes to read
The Debug Visualizer simplifies code debugging. It supplements your code with visual elements that helps you understand the current execution state better. This article describes the following CodeRush debugging features in details.
Expression viewer
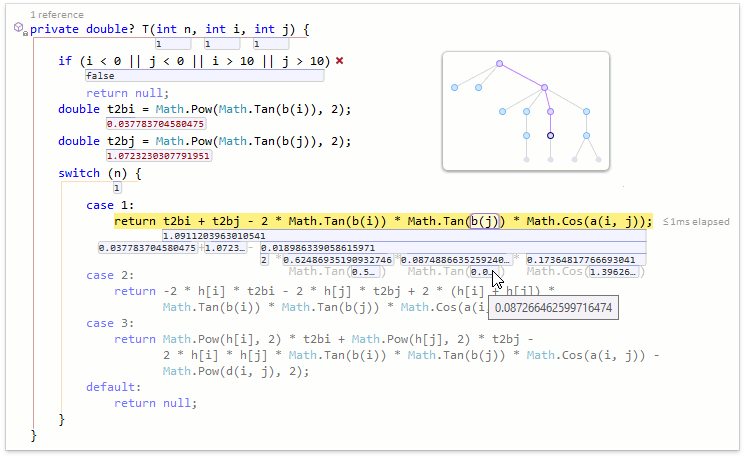
You can view the value of each part of an expression, as well as the entire expression value. Click the expression value located under the expression, then press the Down Arrow key to view the values of expression parts (or press Alt+Down Arrow if the caret is on the same line with the expression).
Use the arrow keys to navigate through values within the expression and Tab/Shift+Tab to switch between expressions.
Press the Esc key to exit the expression viewer.
The graph on the right is called Expression Map. It allows you to understand the expression structure at a glance.
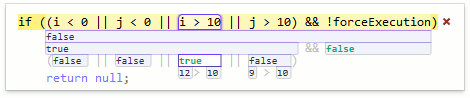
Icons for boolean variables
The Debug Visualizer visually shows whether a conditional statement is true ( ) or false (
 ). If a Boolean expression consists of several parts, the Debug Visualizer highlights the child expressions that determine the parent value.
Execution path highlighting
The Debug Visualizer de-emphasizes missed code blocks to highlight the current execution path.
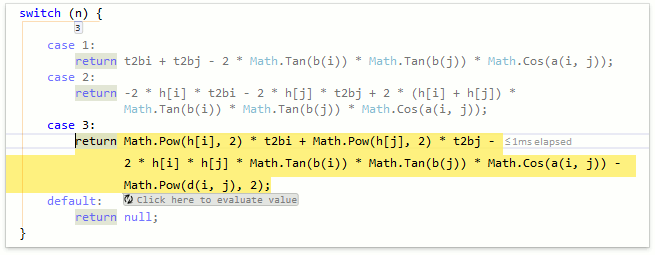
Side effects investigator
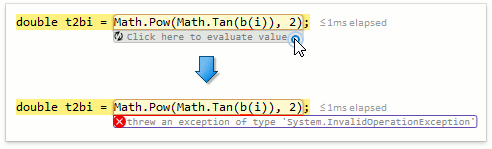
When you perform step-by-step execution, the Debug Visualizer allows you to execute an expression safely. If the expression can cause side effects, it is supplemented with the Click to evaluate button. Using this button, you can force execution of the expression in the sandbox and find whether its execution has succeeded or failed.
Hover the mouse over the Click to evaluate button to see what parts of expression can cause side effects: these parts will be underlined with a thin red line (the b method in the example below).
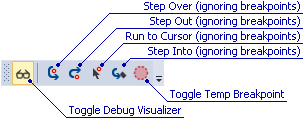
Debug Toolbar
To easily access the Debug Visualizer features, you can use the corresponding visual studio toolbar. If it is disabled, right-click anywhere within a free space in the menu bar and select the CodeRush Debug option.
Configuration
You can disable any of the Debug Visualizer features using the Editor | All Languages | Debug Visualizer options page.