Analyze Code Coverage
- 3 minutes to read
CodeRush includes the Code Coverage tool window to analyze code coverage. This window shows which parts of your solution are covered by the unit tests and identifies untested cases.
Run Code Coverage Analysis
Use one of the following approaches to run tests with code coverage:
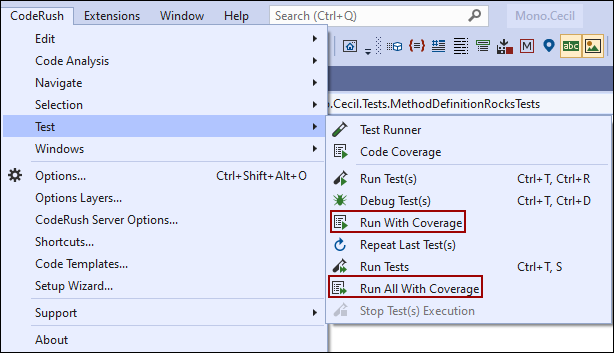
Option 1
The CodeRush | Test menu to run selected test(s) or all tests with coverage in the solution.
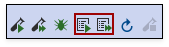
Option 2
The CodeRush Visualize toolbar’s commands to run tests with coverage.
Option 3
Visual Studio’s context menu.

After you run tests with coverage, CodeRush invokes the Code Coverage window that updates data during test execution.
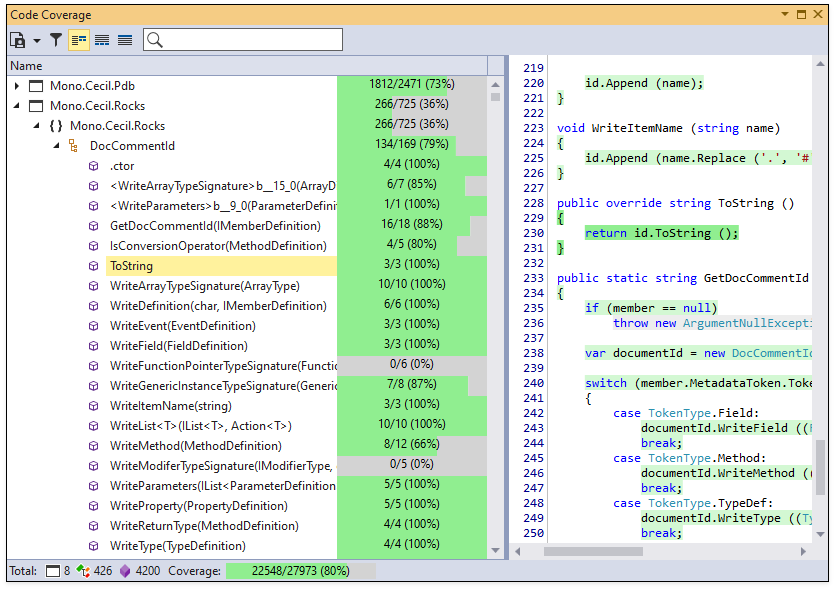
When all tests are completed, you can see the information about code coverage in the Code Coverage window.
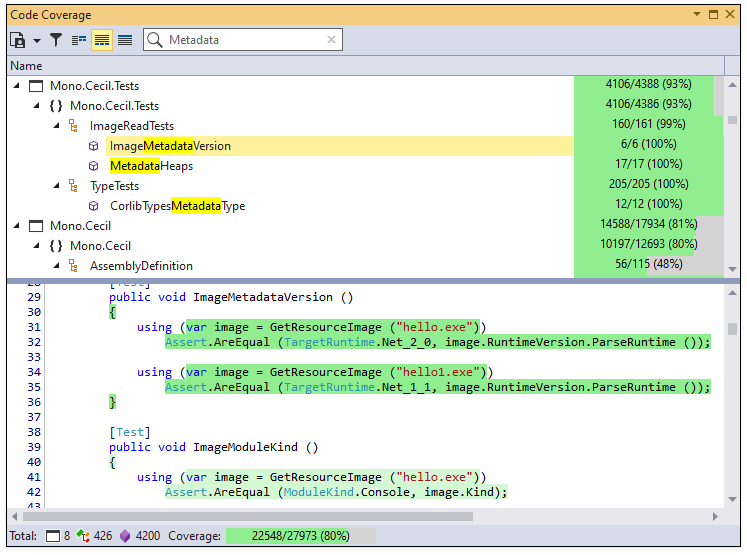
Use the Search Box to find members in the coverage report.
Choose Code Coverage Window Layout
You can set the Code Coverage window to one of the following layout modes:
Show code coverage details on the right of the report
Show code coverage details below the report
Hide code coverage details
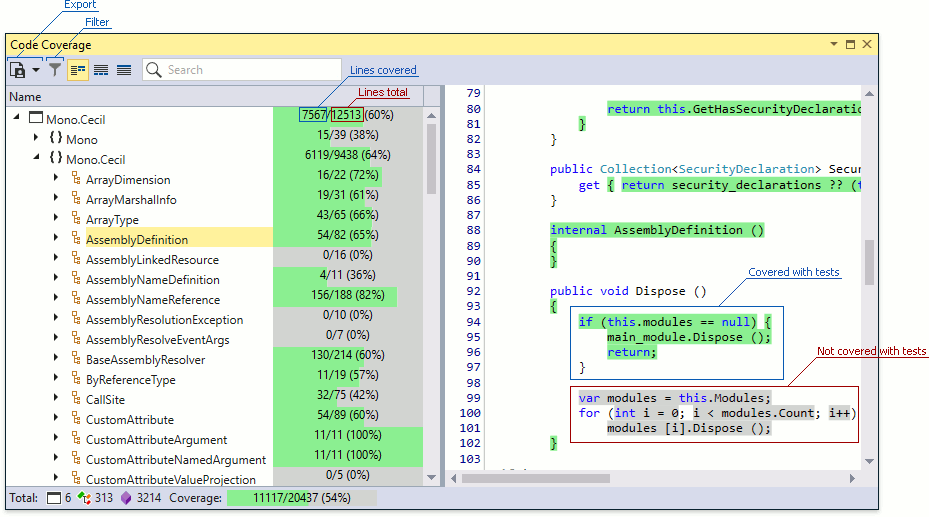
The following screenshot shows “Code coverage details on the right of the report” mode:
Code Coverage Highlighting
CodeRush highlights code lines to visualize coverage. You can see the highlighted code lines for the selected member in the code coverage details view.
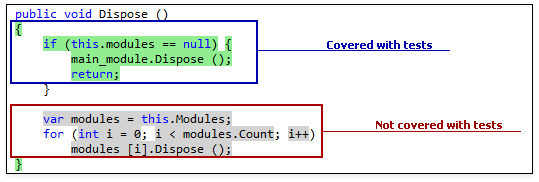
Green lines in code indicate that the code is covered by tests. Code lines highlighted in gray indicate the code is not covered by tests.
Code Coverage Calculation
CodeRush uses the statement code coverage metric to measure code coverage. The Code Coverage tool window shows the percentage of statements covered by unit tests for each solution’s member.
For example, 6 of 11 statements are covered in the screenshot above. The code coverage is 6 out of 11 statements (54.5% coverage).
Filter Report Data
You can filter the report data by name, percentage, and node kind to see items that require attention.
Perform the following actions to specify a filter condition in the Filter Editor:
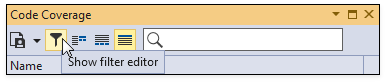
1) Click the Show filter editor toolbar button to open the Filter Editor.
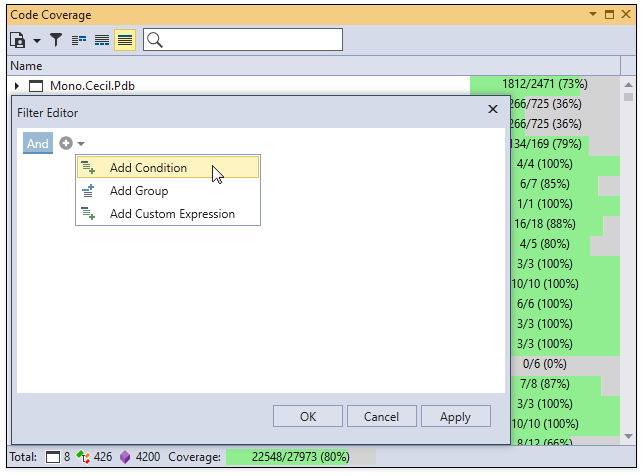
2) Click the drop-down button and choose the Add Condition item.
3) Click Name and select a filter in the list.
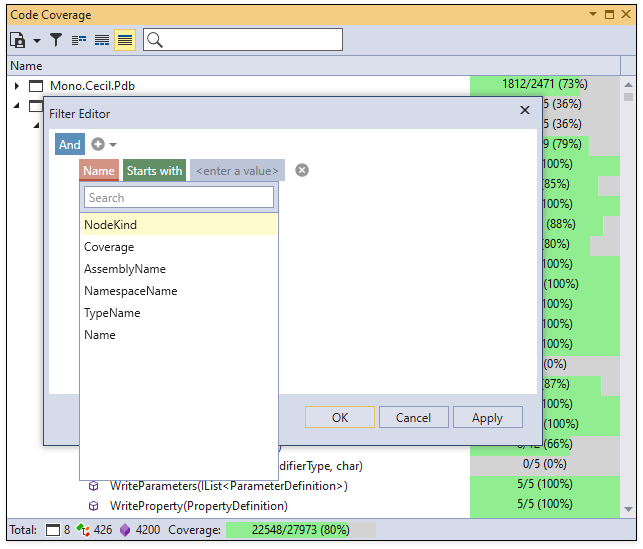
4) Choose a criteria operator and specify the operand value.
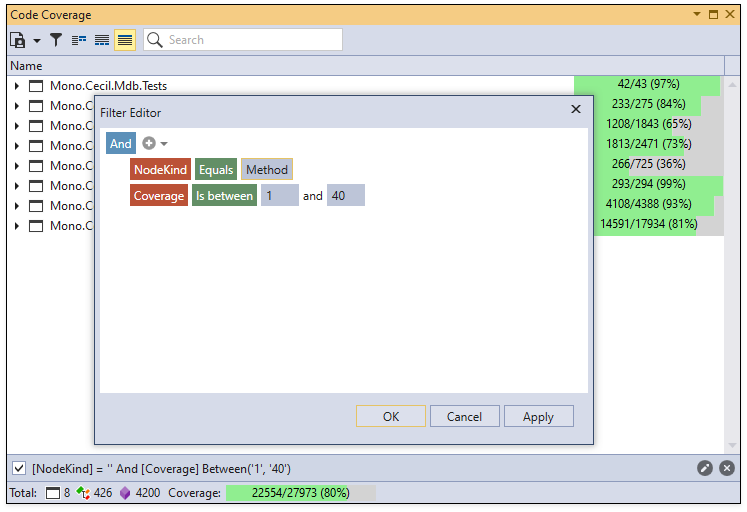
For example, you can create a filter that shows methods with test coverage between 1% and 40%:
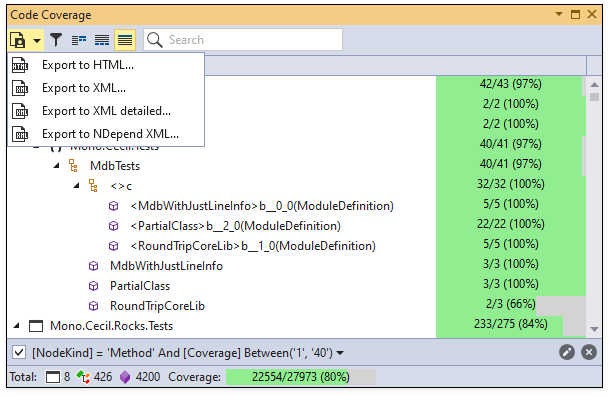
Export Code Coverage Report
CodeRush allows you to export a code coverage report to HTML, XML, detailed XML or NDepend XML.
Run Settings File Support
You can use a .runsettings file to exclude the following members and assemblies from code coverage analysis:
- Projects
- Functions
- Source files
- Signed assemblies by the public key token.
- Elements that match the specified attributes.
- Assemblies with a specific value in the AssemblyCompany attribute.
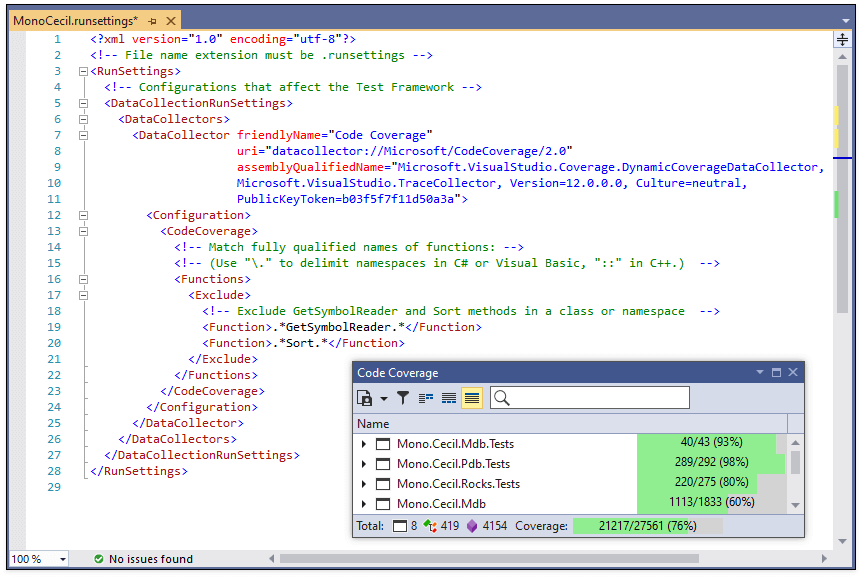
The following screenshot shows the MonoCecil.runsettings file that excludes “GetSymbolReader” and “Sort” functions from Code Coverage analysis:
For more information on the run settings file, refer to the following article on Microsoft’s website: Customizing Code Coverage Analysis.