Zooming and Scrolling
The Chart control allows scrolling and zooming its content. These capabilities have contiguous functionality and should be enabled simultaneously. This topic consists of the following sections:
Zooming
To enable scrolling, specify the ArgumentAxis and ValueAxis properties.
The following code sample implements the chart’s zooming capability:
<dx:BootstrapChart ID="ChartLine" runat="server" DataSourceUrl="~/Content/fullstackedbar.json" TitleText="Energy Consumption in 2004" SubtitleText="(Millions of Tons, Oil Equivalent)" ZoomingMode="All">
    <SettingsCommonSeries ArgumentField="country" />
    <SeriesCollection>
        <dx:BootstrapChartLineSeries ValueField="hydro" Name="Hydro-electric" />
        <dx:BootstrapChartLineSeries ValueField="oil" Name="Oil" />
        <dx:BootstrapChartLineSeries ValueField="gas" Name="Natural gas" />
        <dx:BootstrapChartLineSeries ValueField="coal" Name="Coal" />
        <dx:BootstrapChartLineSeries ValueField="nuclear" Name="Nuclear" />
    </SeriesCollection>
    <ArgumentAxis ValueMarginsEnabled="false" DiscreteAxisDivisionMode="CrossLabels" GridVisible="true" TickInterval="1" />
    <SettingsLegend HorizontalAlignment="Center" VerticalAlignment="Bottom" ItemTextPosition="Bottom" />
    <ValueAxisCollection>
        <dx:BootstrapChartValueAxis TitleText="millions" />
    </ValueAxisCollection>
</dx:BootstrapChart>
Scrolling
Scrolling allows end users to navigate the zoomed chart’s content.
Set the Visible property to true and specify the ArgumentAxis and ValueAxis properties to enable scrolling.
You can also customize a bar’s position and offset using the corresponding BootstrapChartScrollBarSettings class properties.
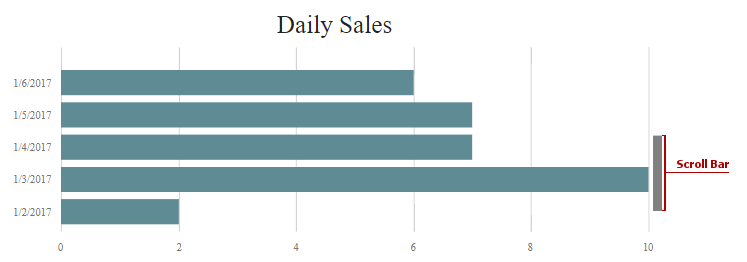
Use the following code to implement the chart above:
<dx:BootstrapChart runat="server" DataSourceUrl="~/Content/simple.json" TitleText="Daily Sales" Rotated="true" ScrollingMode="All" ZoomingMode="All">
    <ArgumentAxis ArgumentType="System.DateTime" MaxValue="1/10/2017" >
        <Label>
            <Format Type="ShortDate" />
        </Label>
        </ArgumentAxis>
    <ValueAxisCollection>
        <dx:BootstrapChartValueAxis TickInterval="1" />
    </ValueAxisCollection>
    <SeriesCollection>
        <dx:BootstrapChartBarSeries ArgumentField="date" ValueField="sales" />
    </SeriesCollection>
        <SettingsScrollBar Visible="True" />
    <SettingsLegend Visible="false" />
</dx:BootstrapChart>