Fields
- 2 minutes to read
Pivot Grid Fields represent data source fields and supply specific data to ASPxPivotGrid. Fields are visually represented by field headers that can be moved between control areas using drag-and-drop. Dragging fields between the areas modifies the layout of the report.
To create a report in ASPxPivotGrid, create pivot grid fields and position them within appropriate areas.
- create a PivotGridField object and add it to the ASPxPivotGrid.Fields collection;
- specify the field’s area and position within this area via the PivotGridFieldBase.Area and PivotGridFieldBase.AreaIndex properties (the PivotGridFieldBase.AreaIndex property can be set only after the field is added to the control’s field collection).
A field can be positioned within one of four areas: Column, Row, Data, and Filter Header Area. The field’s function is determined by the area in which it is displayed:
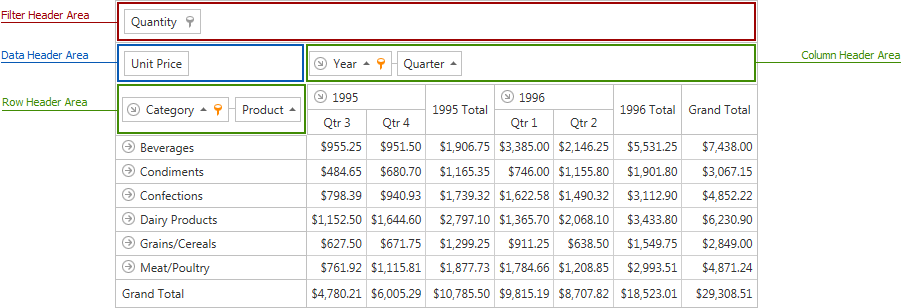
- position a field within the Column Header Area to list its values along the control’s top edge. This field’s values will represent column headers;
- position a field within Row Header Area to list its values along the control’s left edge. This field’s values will represent row headers;
- position a field within Data Header Area to calculate summaries against this fields. The summaries will be calculated for all the cells; each cell is identified by a specific column and row;
- position a field within the Filter Header Area to make this field available for further customizations. For instance, it can be dragged to a different area later. In addition, an end-user can filter data against a filter field via the filter drop-down.
Binding Basics
ASPxPivotGrid supports bound and unbound fields. A bound field retrieves data from a field in a pivot grid’s data source. An unbound field is not associated with a data source and should be populated with data manually. To learn more on unbound fields, see Unbound Fields.
To bind a pivot grid field to a data source field, use the PivotGridField.FieldName property. This property provides the name of the data field bound to a pivot grid field. The PivotGridFieldBase.UnboundType property must be set to UnboundColumnType.Bound.
To learn more, see Binding to Data Overview and Binding to OLAP Data Sources.