Lesson 4 - Use a Series Template for Auto-Created Series
- 4 minutes to read
This document provides step-by-step instructions on how to create a Web application with a WebChartControl control bound to data. In this example, all series will be auto-created by a chart using a series template, which specifies common data binding properties for all series.
This is possible because the data for all series (the series’ names along with series’ points’ arguments and values) are stored in the same data table. Also, in this example the series view type and other settings should be the same for all series to be created.
In this example, you will use the “GSP” table in the GSP database (the gsp.mdb file shipped with the ASP.NET Chart Control installation). This table contains the Gross State Product (GSP) statistics for various US regions.
Create a Web chart via the steps below.
- Step 1. Create a Chart and Bind It to Data
- Step 2. Specify a Series Data Member and Adjust a Series Template
- Step 3. Populate the Chart with Data at Design Time
- Step 4. Customize the Chart
- Get the Result
Create a Chart and Bind It to Data
- Create a new ASP.NET Web Application (Visual Studio 2012, 2013, 2015, 2017 or 2019) or open an existing one.
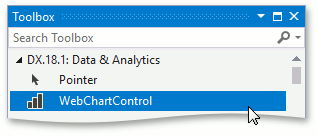
Drop the WebChartControl from the DX.19.2: Data & Analytics toolbox tab onto the form.
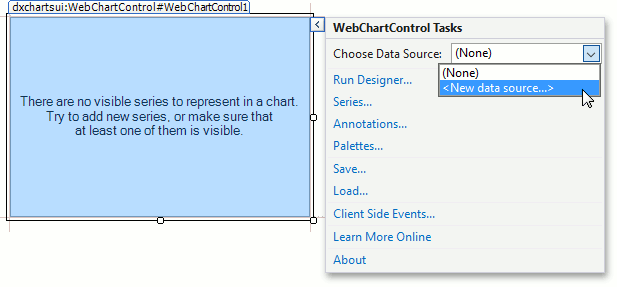
Click the chart’s smart tag to invoke its actions list. Then, open the drop-down list for the Choose Data Source item and click the <New data source…> link.
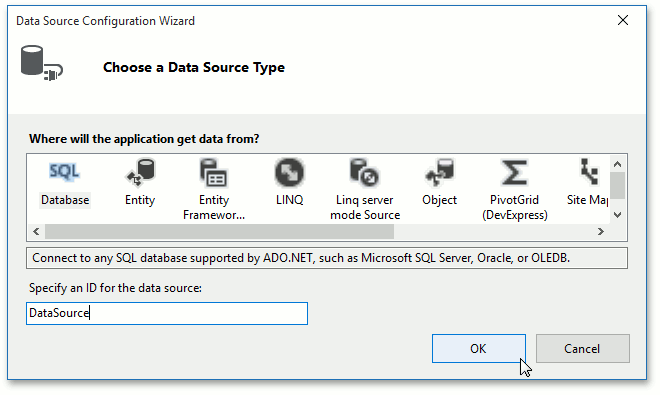
This will invoke the Data Source Configuration Wizard. Choose the SQL Database type and click OK.
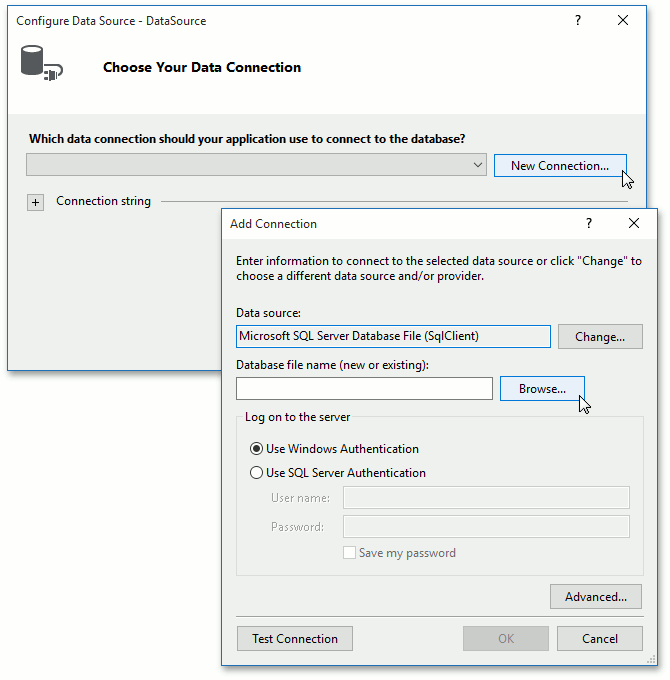
On the next page, click New Connection…, and in the invoked Add Connection dialog, perform the following actions.
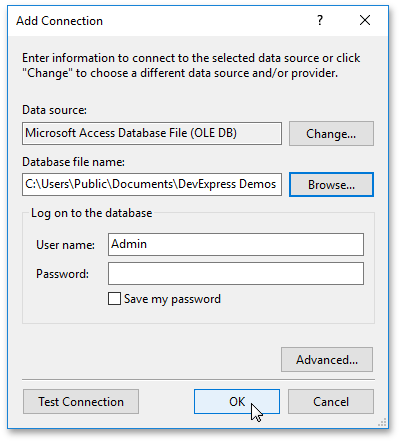
- Specify Microsoft Access Database File (OLE DB) as the Data source type. If necessary, use the Change… button to select between different types.
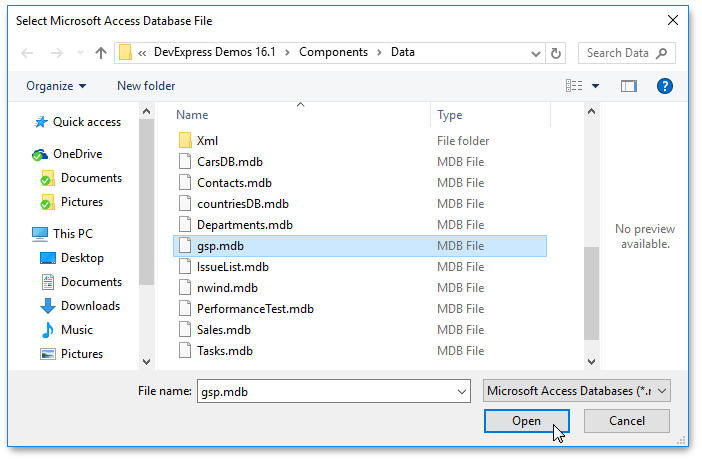
Click Browse… to set the gsp.mdb file as the data source file.
In the invoked dialog, select the database file and click Open.
Note
By default, gsp.mdb is stored in the following path.
C:\Users\Public\Documents\DevExpress Demos 16.1\Components\Data
Click OK to close the dialog.
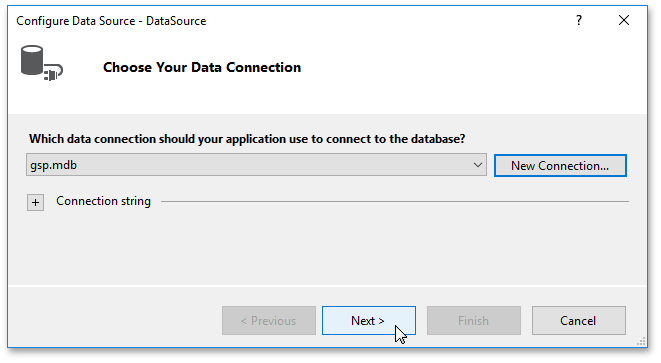
Click Next> to proceed.
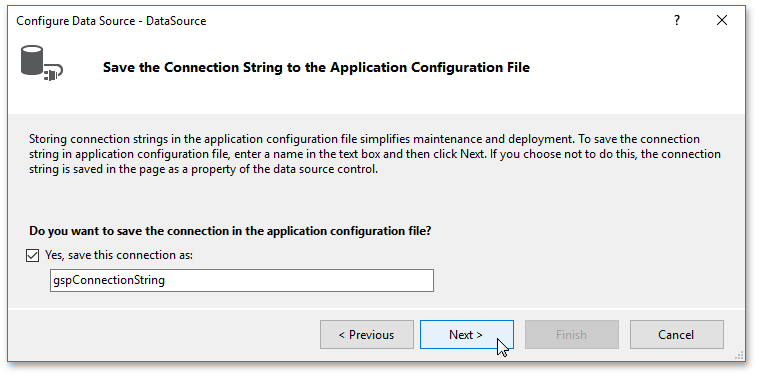
In the Save the Connection String to the Application Configuration File window, click Next>.
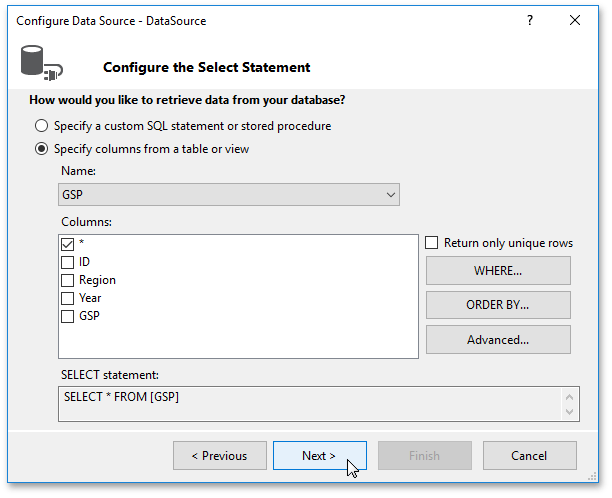
Leave the next page as is, and click Next>.
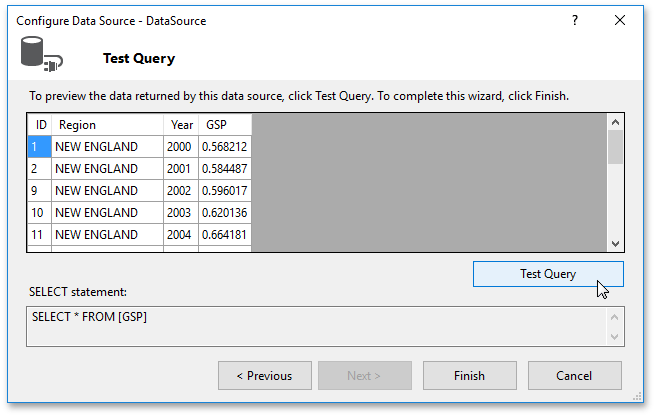
On the last page, you can test the database connection by clicking Test Query.
- Click Finish to create the datasource.
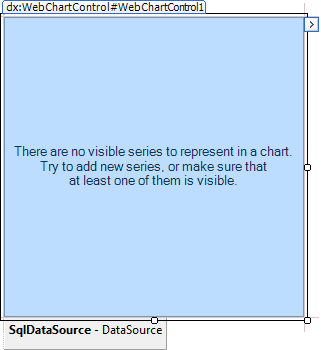
The DataSource object is now assigned to the chart.
Specify a Series Data Member and Adjust a Series Template
Since in this example, the chart will represent the data as different series, series points and their values, all series will be created using a series template that is common to all of them. The following steps demonstrate how this can be done.
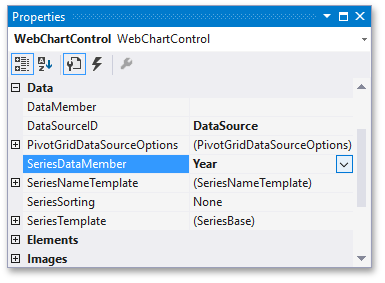
Set the WebChartControl.SeriesDataMember property to Year to specify the data field that should provide data for the series names.
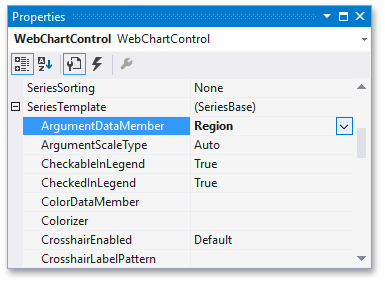
Next, adjust the series template via the WebChartControl.SeriesTemplate property. Set the SeriesBase.ArgumentDataMember property to Region.
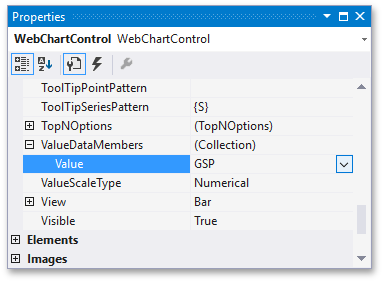
Then, set the value for the SeriesBase.ValueDataMembers collection’s only member to GSP.
Populate the Chart with Data at Design Time
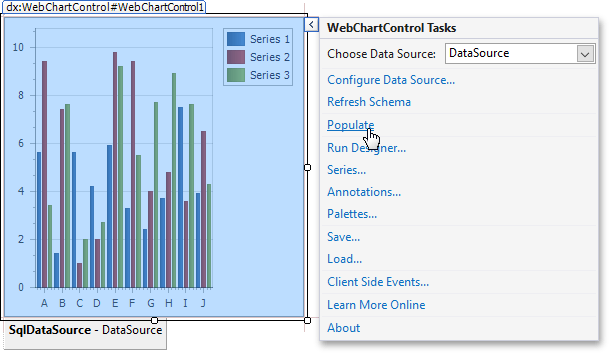
To see how the chart will look at design time, click its smart tag, and in its actions list, click Populate. This will redraw the chart using the obtained data.
Customize the Chart
Adjust the Series Name Template
By default, the name for each series automatically generated by the chart using its WebChartControl.SeriesDataMember property value is obtained directly from an appropriate data field in the bound data source. It may also be necessary to add some prefixes or postfixes to these names, in which case you can customize the SeriesNameTemplate object returned by the WebChartControl.SeriesNameTemplate property to add text to the beginning or end of each series name. In this instance, set the SeriesNameTemplate.BeginText property to “GSP in “.
Adjust the Crosshair Cursor Options
By default, the crosshair cursor argument line and crosshair common label are displayed on a chart. You can disable (or enable) a crosshair cursor both at the level of a chart via the WebChartControl.CrosshairEnabled property and at the level of a chart series using the SeriesBase.CrosshairEnabled property.
To show the crosshair cursor value line and crosshair cursor axis labels, set the CrosshairOptions.ShowValueLine, CrosshairOptions.ShowArgumentLabels and CrosshairOptions.ShowValueLabels properties to true.
If required, it is possible to customize many other properties for the chart, which are not described here.
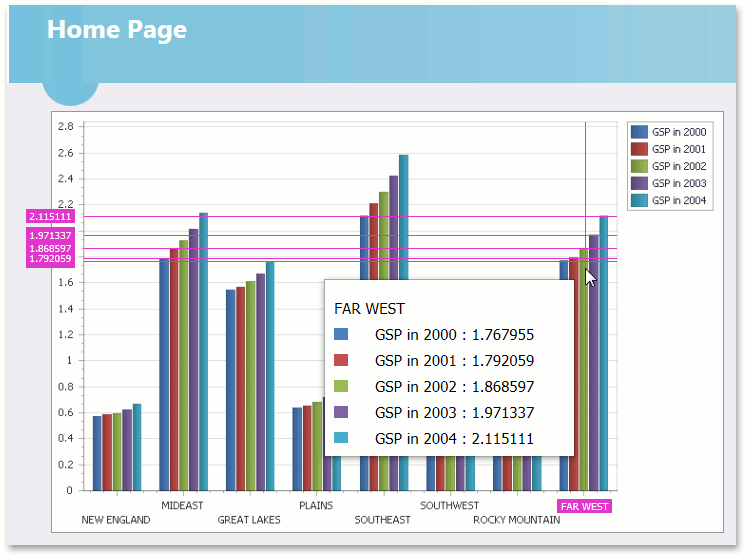
Get the Result
The resulting Web chart is shown in the following image.