Manually Create a Series
- 2 minutes to read
This document describes how you can add new series to your chart.
To allow individual customization of your chart’s series, they should be added to the chart’s collection, returned by the WebChartControl.Series property.
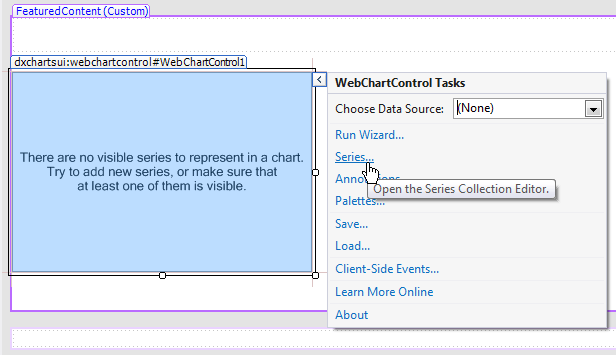
To quickly create series at design time, click your web chart control’s smart tag, and in the invoked actions list, click the Series… link.
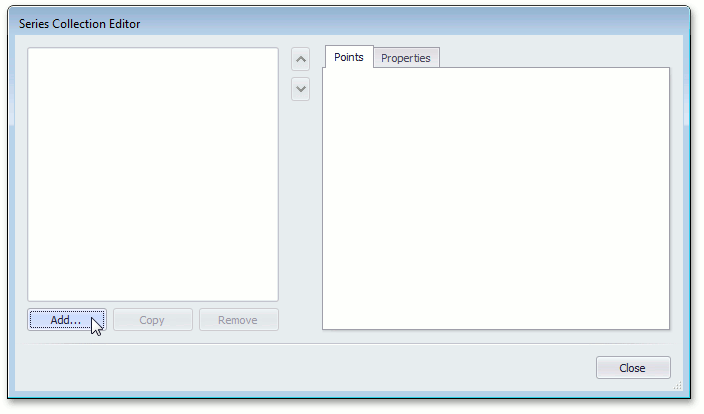
In the invoked Series Collection Editor, click Add…, to add a series to the collection. Note that the order in which series are stored within the collection determines their order in the chart’s legend.
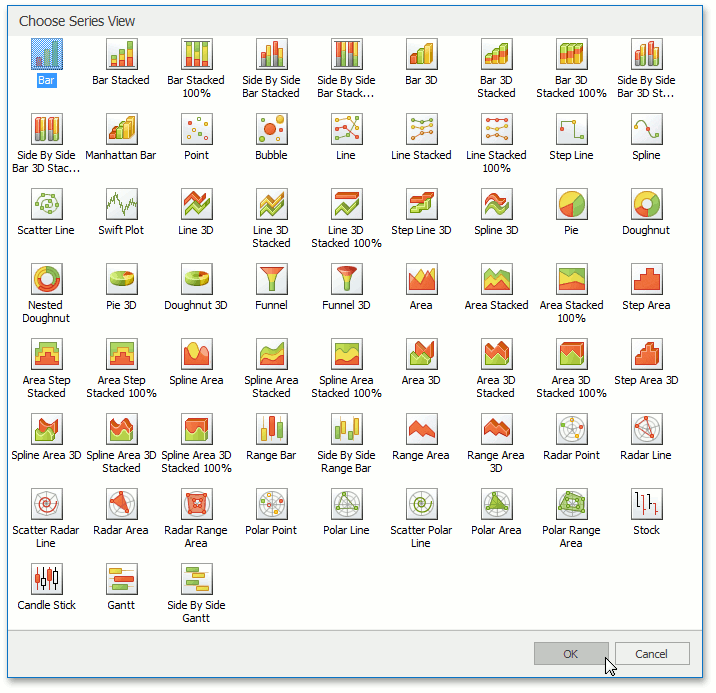
Then, you’ll be asked to choose a view type for the series, which defines the visual representation of a series, and prescribes a specific set of options.
Note
There is a strong correlation between the series view type and the chart’s diagram type, which is auto-determined by the view type of the first visible series in the collection. So, to use multiple series in your chart, their view types should be compatible. Otherwise, a red error message is displayed at the bottom of the dialog. For details on this, refer to Combining Different Series Views.
Choose a view type, and click OK.
Now, the series is created, but it will not be displayed until it has at least one point. There are two approaches to populating a series with points.
- manually add points to a series collection, with point arguments and values being individually specified;
- specify a series data source, based on which, a series is populated automatically.