TimeSpanChartRangeControlClient Class
The RangeControl‘s client that renders a lightweight chart with a time-span horizontal axis.
Namespace: DevExpress.XtraEditors
Assembly: DevExpress.XtraEditors.v25.1.dll
NuGet Package: DevExpress.Win.Navigation
Declaration
Remarks
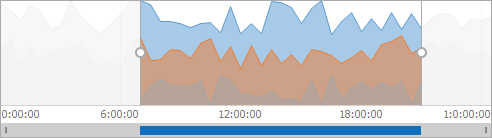
To display data as a chart with a time-span horizontal axis in the RangeControl, assign a TimeSpanChartRangeControlClient object to the RangeControl.Client property.
To set up a TimeSpanChartRangeControlClient, use the following settings that are accessible from the ChartRangeControlClientBase.DataProvider inherited property.
- ChartRangeControlClientDataProvider.DataSource - Gets or sets the chart range control client provider’s data source.
- ChartRangeControlClientDataProvider.ArgumentDataMember - Gets or sets the name of the data field that contains the arguments of the chart range control client’s points.
- ChartRangeControlClientDataProvider.ValueDataMember - Gets or sets the name of the data field that contains the point values of a chart range control client.
- ChartRangeControlClientDataProvider.SeriesDataMember (optionally) - Gets or sets the name of the data field whose values are used to automatically generate and populate the series of a chart range control client.
Example
This example demonstrates how to configure a range control with the time-span chart client to display a chart with time-span data in the range control’s background.
In order to provide data to a chart time-span range control client, access the ChartRangeControlClientDataProvider object using the ChartRangeControlClientBase.DataProvider property and assign a data source to the ChartRangeControlClientDataProvider.DataSource property. Then specify the required data fields via the ChartRangeControlClientDataProvider.ArgumentDataMember, ChartRangeControlClientDataProvider.ValueDataMember, and ChartRangeControlClientDataProvider.SeriesDataMember (optional) properties.
In the current example, a time-span chart client is bound to a simple data table containing three columns (“Argument”, “Value”, and “Series”).
In addition, this example shows how to customize chart client common settings (e.g., change the time-span range, customize template view and grid options).
using DevExpress.XtraEditors;
using System;
using System.Data;
using System.Drawing;

namespace TimeSpanChartRangeClient {
    public partial class Form1 : XtraForm {
        public Form1() {
            InitializeComponent();

            // Assign a time-span chart client to the Range control.
            rangeControl1.Client = timeSpanChartRangeControlClient1;

            // Generate a data table and bind the time-span client to it.
            timeSpanChartRangeControlClient1.DataProvider.DataSource = CreateChartData(100, 2);

            // Specify data members to bind the client.
            timeSpanChartRangeControlClient1.DataProvider.ArgumentDataMember = "Argument";
            timeSpanChartRangeControlClient1.DataProvider.ValueDataMember = "Value";
            timeSpanChartRangeControlClient1.DataProvider.SeriesDataMember = "Series";

            // Specify the chart range control client view.
            AreaChartRangeControlClientView areaView = new AreaChartRangeControlClientView();
            timeSpanChartRangeControlClient1.DataProvider.TemplateView = areaView;

            // Customize the area view appearance.
            areaView.AreaOpacity = 90;
            areaView.Color = Color.Aqua;
            areaView.ShowMarkers = true;
            areaView.MarkerSize = 5;
            areaView.MarkerColor = Color.Red;

            // Format labels of the time-span chart range control client.
            timeSpanChartRangeControlClient1.GridOptions.LabelFormat = "c";

            // Specify the palette name to get a nice-looking chart.
            timeSpanChartRangeControlClient1.PaletteName = "Office";

            // Customize grid alignment, grid spacing, snap spacing and snap alignment of the chart range control client.
            timeSpanChartRangeControlClient1.GridOptions.GridAlignment = RangeControlTimeSpanGridAlignment.Hour;
            timeSpanChartRangeControlClient1.GridOptions.GridSpacing = 1;
            timeSpanChartRangeControlClient1.GridOptions.SnapSpacing = 1;
            timeSpanChartRangeControlClient1.GridOptions.SnapAlignment = RangeControlTimeSpanGridAlignment.Hour;

            // Change the time-span range of the chart range control client.
            timeSpanChartRangeControlClient1.Range.Min = TimeSpan.FromHours(9);
            timeSpanChartRangeControlClient1.Range.Max = TimeSpan.FromHours(18);
        }
        private DataTable CreateChartData(int pointCount, int seriesCount) {

            // Create an empty table.
            DataTable table = new DataTable("Table1");

            // Add three columns to the table.
            table.Columns.Add("Argument", typeof(TimeSpan));
            table.Columns.Add("Value", typeof(Double));
            table.Columns.Add("Series", typeof(string));

            // Add data rows to the table.
            Random rand = new Random(10);
            DataRow row = null;
            double value = 0;

            for (int seriesIndex = 0; seriesIndex < seriesCount; seriesIndex++) {
                for (int pointIndex = 0; pointIndex < pointCount; pointIndex++) {
                    value += (rand.NextDouble() - 0.3);
                    row = table.NewRow();
                    row["Argument"] = TimeSpan.FromMinutes(pointIndex * 30);
                    row["Value"] = Math.Sin(pointIndex) + value;
                    row["Series"] = seriesIndex.ToString();
                    table.Rows.Add(row);
                }
            }
            return table;
        }
    }
}