Summarization in BI Dashboard Controls
- 3 minutes to read
One of the main purposes of data grouping is calculating summaries corresponding to dimension values. For instance, you can sum values, determine the maximum, minimum, average value or count all the values.
To compute these summaries, the Dashboard uses a summary function calculated against the specified measure.
This topic describes how the Dashboard summarizes measure values by default and lists the available summary functions. It also shows how to change the default summary type.
Summarization Overview
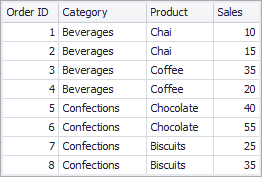
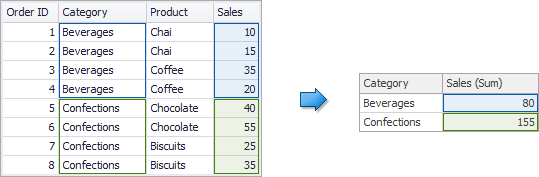
For instance, you need to calculate a sum of sales for each dimension value. A sample underlying data source contains the following data.
If you use the Category field as a dimension and the Sales field as a measure with the Sum summary function, the Dashboard will sum all underlying data source values corresponding to ‘Beverages’ and ‘Confections’.
If you use the Max summary function, the maximum value corresponding to each category will be selected.

Available Summary Functions
The following summary functions are available.
Note
Values Null and DBNull are excluded from calculations.
Count | The number of values. |
Count Distinct | The number of distinct values. |
Sum | The sum of the values.
|
Min | The smallest value. |
Max | The largest value. |
Average | The average of the values.
|
StdDev | An estimate of the standard deviation of a population where the sample is a subset of the entire population.
|
StdDevP | The standard deviation of a population where the population is the entire data to be summarized.
|
Var | An estimate of the variance of a population where the sample is a subset of the entire population.
|
VarP | The variance of a population where the population is the entire data to be summarized.
|
Median | The median of the values. A median is the number separating the higher half of a value range from the lower half. |
Mode | The mode of the values. A mode is the value that is repeated more often than any other. |


Change Summary Type
The Dashboard calculates Sum for numeric measures and Count for measures that contain another type of data. You can change the summary function type in the Dashboard Designer and in code.
Obtain Underlying Data
If you need to obtain underlying data for the WinForms DashboardViewer or Web DashboardControl, refer to the following help topics for more information:
- WinForms Viewer - Obtaining Underlying and Displayed Data
- Web Dashboard - Obtaining Underlying and Displayed Data
Limitations
Note that changes to the summary type are not available in certain cases.
- You cannot change the summary function type in OLAP mode, because data in a cube is already grouped and summarized.
- Several summary types are not supported for specific data providers in server mode. To learn more, see Data Processing Modes.