DashboardTelemetry Class
Allows you to inspect performance (timing) of the main DevExpress BI Dashboard’s data processing operations.
Namespace: DevExpress.DashboardCommon.Diagnostics
Assembly: DevExpress.Data.v23.2.dll
NuGet Package: DevExpress.Data
Declaration
Remarks
The BI Dashboard Diagnostic Tool allows you to monitor performance of the main DevExpress BI Dashboard’s data processing operations (such as data load and filter operations). You can estimate execution time for each operation or see the number of code calls for the session period.
DashboardTelemetry allows the Dashboard Diagnostic Tool to create custom logs for specific code blocks.
Create Custom Benchmarks
Benchmarks are used to measure and compare performance.
You can create a benchmark in the following ways:
Pass a delegate that encapsulates the method you want to diagnose in the DashboardTelemetry.Log(System.String,System.Action) or DashboardTelemetry.Log(System.String,System.Func{``0}) method. Specify the benchmark name as the method’s parameter.
Create a
DashboardTelemetryclass instance before the code execution. Specify the benchmark name in the object’s constructor. Call the DashboardTelemetry.Dispose() method after the code you diagnose to release all the resources used by the object. You can also use the using statement or using declaration.
Create Custom Events
Tracing allows you to trace the execution of your code.
Call the following methods to generate trace events and obtain more information about executed code:
- TraceInformation(Object)
- Records the object’s information that is collected since the trace started.
- TraceError(Object)
- Records all error events since the trace started.
- TraceWarning(Object)
- Records all notification events since the trace started.
Use the BI Dashboard Diagnostic Tool to Inspect Custom Logs
To display custom logs in the Dashboard Diagnostic Tool, you need to create custom benchmarks and trace events before you run your dashboard application.
Open the dashboard application.
Select the code you wish to diagnose. Create custom benchmarks.
Generate trace events to obtain more information about the executed code.
Download and run the BI Dashboard Diagnostic Tool.
Start a new session to collect performance data for your code. Follow the step-by-step instructions on how to use the BI Dashboard Diagnostic Tool.
When you complete the session, the custom logs are displayed in the log tree along with other results of the data processing operation in the BI Dashboard Diagnostic Tool’s interface.
Example
The code snippet below shows how to diagnose a data load operation for a custom Sunburst item.
using DevExpress.DashboardCommon.Diagnostics;
//...
protected override void UpdateControl(CustomItemData customItemData) {
ClearDataBindings();
if (ValidateBindings()) {
using (DashboardTelemetry telemetry = new DashboardTelemetry("DataAction.GetFlatData")) {
flatData = customItemData.GetFlatData(new DashboardFlatDataSourceOptions() { AddColoringColumns = true,
AddDisplayTextColumns = true });
multiDimensionalData = customItemData.GetMultiDimensionalData();
SetDataBindings(flatData);
SetColorizer(flatData);
SetSelectionMode();
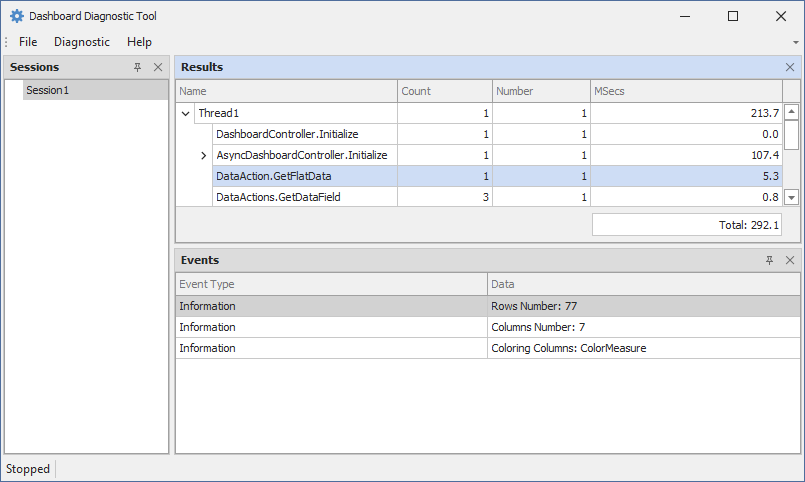
DashboardTelemetry.TraceInformation($"Rows Number: {flatData?.Count}");
DashboardTelemetry.TraceInformation($"Columns Number: {flatData?.GetColumns().Count}");
DashboardTelemetry.TraceInformation($"Coloring Columns: {flatData?.GetColoringColumn().DisplayName}");
};
}
}
The following image shows the resulting session:
Refer to the following example to see the source code used in the code snippet above: Dashboard for WinForms - Custom Item Extensions.