Debug Visualizer
- 2 minutes to read
The Debug Visualizer simplifies code debugging. It supplements your code with visual elements that help you understand the current execution state. The following CodeRush debug features are available:
Expression Viewer
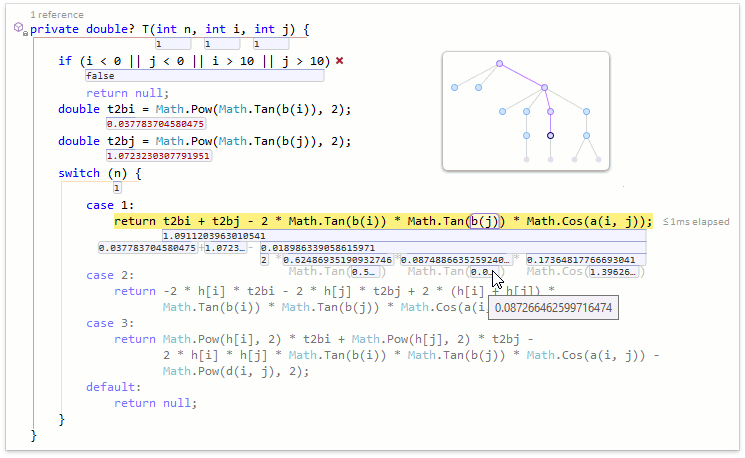
The Expression Viewer allows you to view the value of each expression part and the entire expression value. Use one of the following ways:
Click the expression value below the expression and press the Down Arrow key to view the values of the expression parts.
Press Alt+Down Arrow if the caret is on the same line as the expression.
Use the arrow keys to navigate through the values within the expression and Tab/Shift+Tab to switch between expressions.
Press the Esc key to exit the Expression Viewer.
The following screencast shows how to use the Expression Viewer:
The Expression Map allows you to understand the expression structure at a glance.
Icons for Boolean Variables
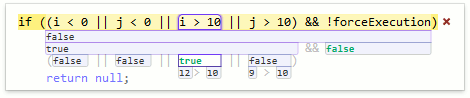
The Debug Visualizer shows whether the conditional statement is true ( ) or false (
 ). If the Boolean expression has multiple parts, the Debug Visualizer highlights the child expressions that determine the parent value.
Execution Path Highlighting
The Debug Visualizer de-emphasizes missing code blocks to highlight the current execution path.
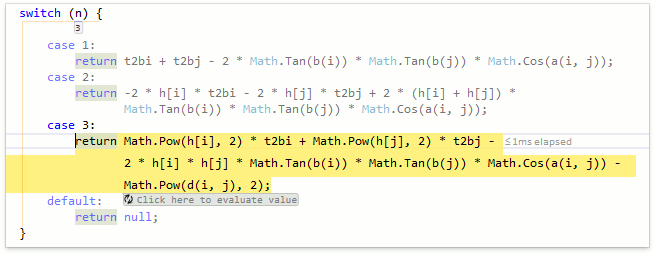
Side Effects Investigator
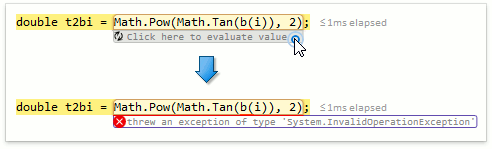
When you step through code, the Debug Visualizer allows you to safely run an expression. If the expression can cause side effects, the Debug Visualizer supplements this expression with the Click here to evaluate value button. Use this button to force the expression execution in the sandbox and see whether its execution has succeeded or failed.
Hover the mouse pointer over the Click here to evaluate value button to see what parts of the expression can cause side effects. CodeRush underlines these parts with a thin red line (see the b method in the example below).
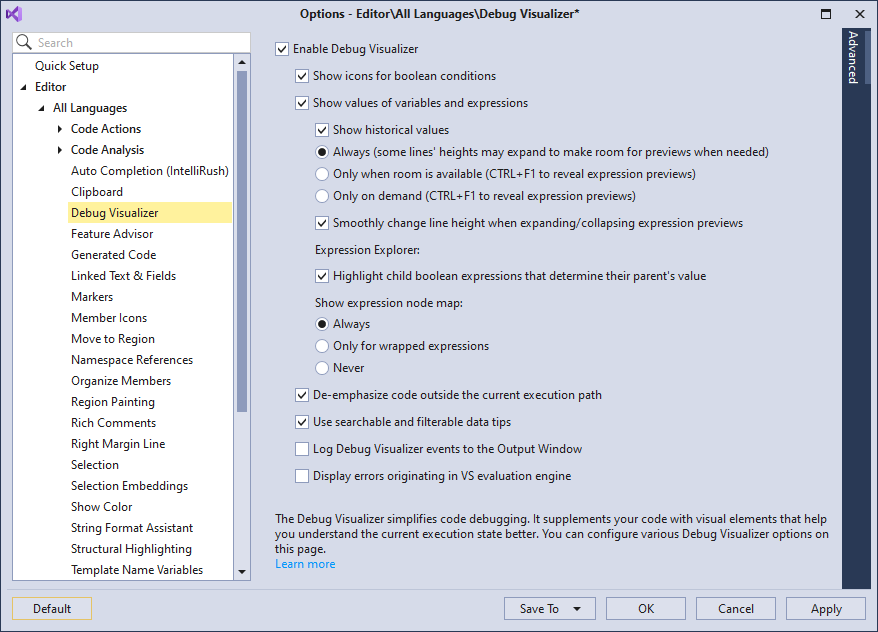
Configuration
The Editor | All Languages | Debug Visualizer options page allows you to enable/disable the Debug Visualizer features.