Data Presentation Basics
- 17 minutes to read
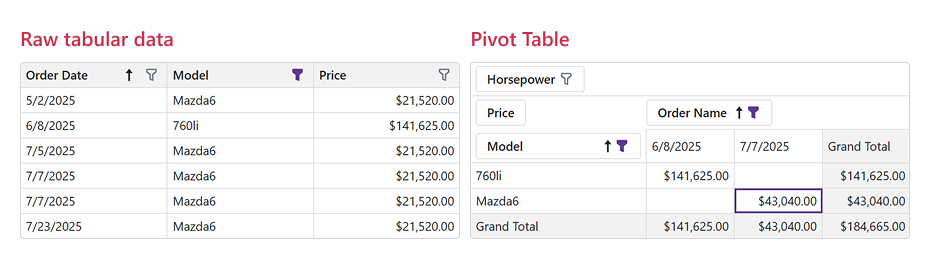
The DevExpress Blazor Pivot Table is designed to convert lengthy table data into compact, interactive reports that display summarized and grouped data. The following image displays how raw tabular data can be transformed into a simple Pivot Table.
This topic describes the component’s visual elements and key concepts of data presentation:
- Areas and fields - Define how raw data is organized and presented.
- Field customization - Users can change data layout at runtime to view the same data from different perspectives.
- Hierarchical data presentation/grouping - The Pivot Table organizes large datasets into categories/hierarchies. Users can drill down from summary to details as needed.
- Aggregation/summaries - Data cells display aggregated metrics (for example, total sales or average quantity).
- Totals/grand totals - The Pivot Table condenses thousands of rows/columns into totals/grand totals.
Areas
The Blazor Pivot Table consists of four areas where you or your user can place database fields.
- Rows Area
- Field headers allow users to re-arrange fields and sort or filter data. Unique values from corresponding fields are displayed as row headers.
- Columns Area
- Field headers allow users to re-arrange fields and sort or filter data. Unique values from corresponding fields are displayed as column headers.
- Data Area
- Field headers allow users to re-arrange fields and sort or filter data. Data cells display information from these fields. Each cell value is a summary calculated against the dataset (filtered by corresponding row/column values).
- Filter Area
- Filter fields do not affect data layout. Use field headers to filter data against fields that are not used in row, column, or data areas. Refer to Filter Data for more information.

Fields
Pivot table fields are data fields that you add to the component to summarize and analyze data.
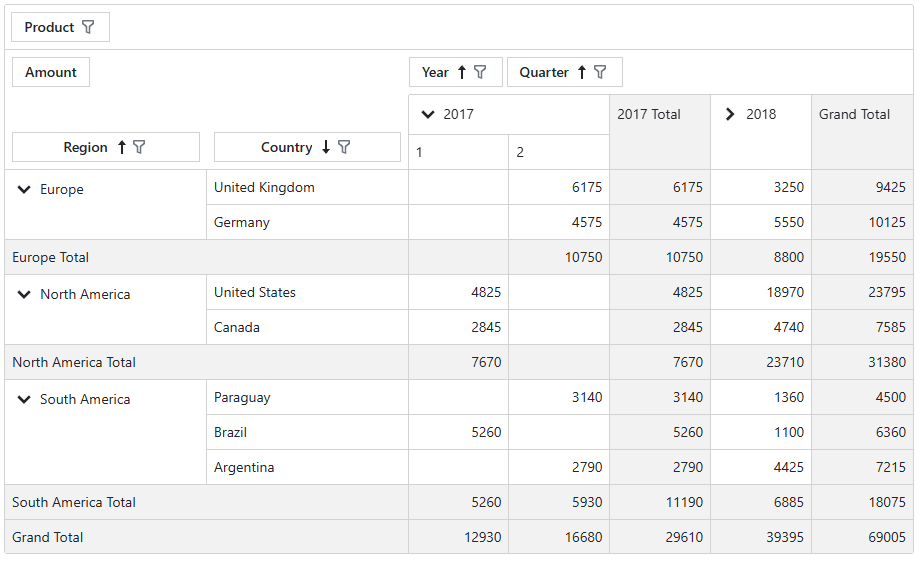
Suppose that you have a SaleInfo class with fields: OrderId, Region, Country, Date, Product, Amount.
public class SaleInfo {
        public int OrderId { get; set; }
        public string Region { get; set; }
        public string Country { get; set; }
        public DateTime Date { get; set; }
        public string Product { get; set; }
        public int Amount { get; set; }
    }
You can create a Pivot Table that:
- Shows Region and Country in Rows.
- Shows Date (Year and Quarter) in Columns.
- Summarizes Amount in data cells.
- Uses Product as a filter to look data for required product.
For detailed steps, see Add Fields.
Add Fields
Follow the steps below to add fields to a Pivot Table:
- Add
<Fields>...</Fields>tags to the component markup to define the Fields collection. - Add DxPivotTableField objects to the collection. Use the Area property to specify an area where a field is displayed: Rows, Columns, Data, or Filter.
- Optional. Set up additional field properties: AreaIndex, Caption, SummaryType (for data fields), CellFormat (for data fields), or ValueFormat (for row/column fields).
@rendermode InteractiveServer

<DxPivotTable Data="SalesData">
    <Fields>
        <DxPivotTableField Field="@nameof(Sales.SaleInfo.Region)"
                           Area="@PivotTableArea.Row"
                           AreaIndex="0" />
        <DxPivotTableField Field="@nameof(Sales.SaleInfo.Country)"
                           Area="@PivotTableArea.Row"
                           SortOrder="@PivotTableSortOrder.Descending"
                           AreaIndex="1" />
        <DxPivotTableField Field="@nameof(Sales.SaleInfo.Date)"
                           GroupInterval="@PivotTableGroupInterval.DateYear"
                           Area="@PivotTableArea.Column"
                           AreaIndex="0"
                           Caption="Year" />
        <DxPivotTableField Field="@nameof(Sales.SaleInfo.Date)"
                           GroupInterval="@PivotTableGroupInterval.DateQuarter"
                           Area="@PivotTableArea.Column"
                           AreaIndex="1"
                           Caption="Quarter" />
        <DxPivotTableField Field="@nameof(Sales.SaleInfo.Amount)"
                           SortOrder="@PivotTableSortOrder.Ascending"
                           Area="@PivotTableArea.Data"
                           SummaryType="@PivotTableSummaryType.Sum" />
        <DxPivotTableField Field="@nameof(Sales.SaleInfo.City)"
                           Area="@PivotTableArea.Filter"/>
    </Fields>
</DxPivotTable>

@code {
    IEnumerable<Sales.SaleInfo> SalesData;
    protected override async Task OnInitializedAsync() {
        SalesData = await Sales.GetSalesAsync();
    }
}
Hierarchical Data Presentation
When you add multiple fields to the Row or Columns area of a Pivot Table, the table automatically groups related data fields into multiple levels (nested rows/columns). This hierarchical organization provides the following benefits for users:
- Drill down or roll up data from summary to detail with a single click.
- Navigate large datasets with ease.
Different Levels of a Data Field
You can bind multiple Pivot Table fields to the same source field, but set different group intervals to split data into different levels. The following example creates a Pivot Table that contains three fields bound to the Date data source field. Field values are grouped as follows: Year → Quarter → Month.
@rendermode InteractiveServer

<DxPivotTable Data="SalesData">
    <Fields>
        <DxPivotTableField Field="@nameof(Sales.SaleInfo.Date)"
                           GroupInterval="@PivotTableGroupInterval.DateYear"
                           Area="@PivotTableArea.Column"
                           AreaIndex="0"
                           Caption="Year" />
        <DxPivotTableField Field="@nameof(Sales.SaleInfo.Date)"
                           GroupInterval="@PivotTableGroupInterval.DateQuarter"
                           Area="@PivotTableArea.Column"
                           AreaIndex="1"
                           Caption="Quarter" >
            <ValueTemplate>
                <span>@($"Q{context.Text}")</span>
            </ValueTemplate>
        </DxPivotTableField>
        <DxPivotTableField Field="@nameof(Sales.SaleInfo.Date)"
                           GroupInterval="@PivotTableGroupInterval.DateMonth"
                           Area="@PivotTableArea.Column"
                           AreaIndex="1"
                           Caption="Month" />
        @*...*@
    </Fields>
</DxPivotTable>

Master-Detail Relationships
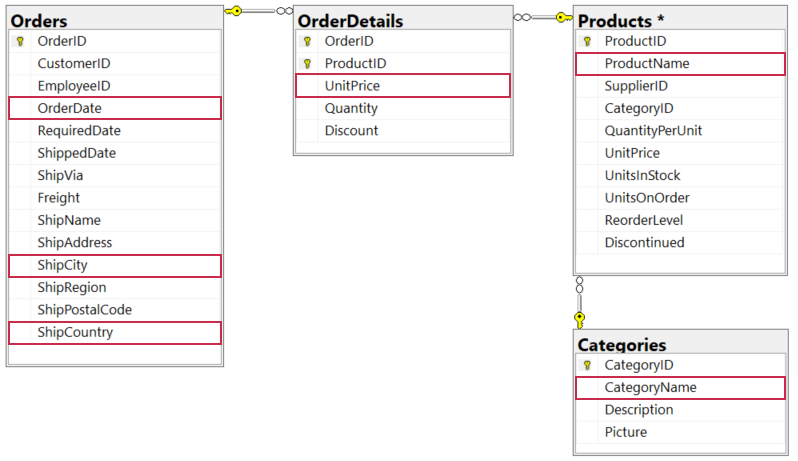
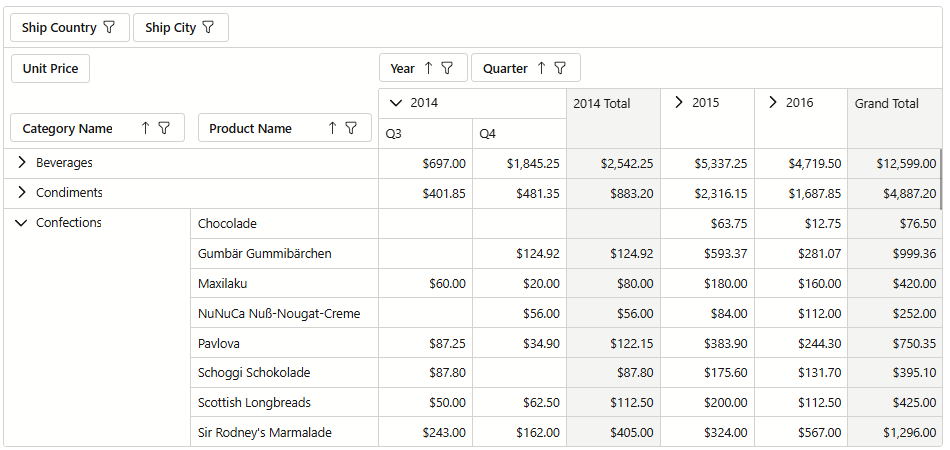
When your dataset includes multiple related tables, a Pivot Table can bring them together into a single view and allows users to explore their hierarchical structure. The following Pivot Table combines data and constructs a hierarchy for Orders, OrderDetails, Products, and Categories data tables.
@inject IDbContextFactory<NorthwindContext> NorthwindContextFactory
@implements IDisposable
@using DevExpress.Blazor.PivotTable

<DxPivotTable Data="Data">
    <Fields>
        <DxPivotTableField Field="CategoryName"
                           Area="@PivotTableArea.Row" />
        <DxPivotTableField Field="ProductName"
                           Area="@PivotTableArea.Row" />
        <DxPivotTableField Field="OrderDate"
                           Area="@PivotTableArea.Column"
                           GroupInterval="@PivotTableGroupInterval.DateYear"
                           Caption="Year" />
        <DxPivotTableField Field="OrderDate"
                           Area="@PivotTableArea.Column"
                           GroupInterval="@PivotTableGroupInterval.DateQuarter"
                           Caption="Quarter">
            <ValueTemplate>
                <span>@($"Q{context.Text}")</span>
            </ValueTemplate>
        </DxPivotTableField>
        <DxPivotTableField Field="UnitPrice"
                           Area="@PivotTableArea.Data"
                           SummaryType="@PivotTableSummaryType.Sum" />
        <DxPivotTableField Field="ShipCountry"
                           Area="@PivotTableArea.Filter" />
        <DxPivotTableField Field="ShipCity"
                           Area="@PivotTableArea.Filter" />
    </Fields>
</DxPivotTable>

@code {
    NorthwindContext Northwind { get; set; }
    IEnumerable<object> Data { get; set; }

    protected override async Task OnInitializedAsync() {
        Northwind = NorthwindContextFactory.CreateDbContext();

        var products = await Northwind.Products.ToListAsync();
        var categories = await Northwind.Categories.ToListAsync();
        var orders = await Northwind.Orders.ToListAsync();
        var orderDetails = await Northwind.OrderDetails.ToListAsync();

        Data = (from c in categories
                      join p in products on c.CategoryId equals p.CategoryId
                      join od in orderDetails on p.ProductId equals od.ProductId
                      select new {
                          CategoryName = c.CategoryName,
                          ProductName = p.ProductName,
                          UnitPrice = p.UnitPrice,
                          OrderDate = od.Order.OrderDate,
                          ShipCountry = od.Order.ShipCountry,
                          ShipCity = od.Order.ShipCity
                      })
              .ToList();
    }

    public void Dispose() {
        Northwind?.Dispose();
    }
}
Field Customization in the UI
The Blazor Pivot Table allows users to customize their data layout by dragging field headers between Rows, Columns, Data, and Filter areas. This capability helps users personalize the Pivot Table structure without modifying code.
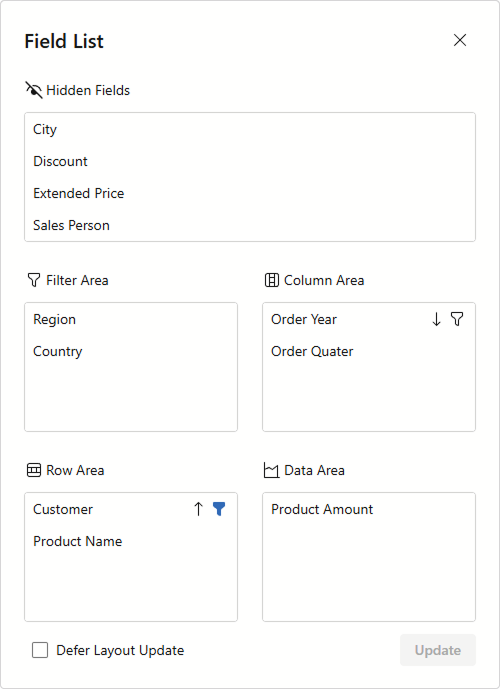
The Pivot Table also includes a Field List that offers an alternative way to manage component structure:
- Reorder fields within each area. This action modifies a field’s AreaIndex property value.
- Move fields across different areas. This action modifies a field’s Area property value.
- Display or hide fields. The Hidden Fields list shows hidden fields. To display a field, users must drag the field to the desired area’s field list. This action modifies a field’s Visible property value.
- Change field sort order. When a user hovers the mouse pointer over a field name in the list, the sort glyph appears next to the field name. A user can click the glyph to change the sort order. The sort glyph and the filter menu button remain visible when users change the sort order or applies filters in the component or Field List. If a user resets the sort order and filters to their default state, the glyph and button disappear.
- Apply field filters. When a user hovers a mouse pointer over a field name in the list, the filter menu button
 appears next to the field name. This button invokes the Filter Menu that allows users to select or clear the desired field values. The sort glyph and the filter menu button remain visible if a user changed the sort order or applies filters in the component or Field List. If a user resets the sort order and filters to their default state, the glyph and button disappear.
 - Defer layout update. When the corresponding checkbox is enabled, the Pivot Table layout is not updated after each customization. Instead, changes are applied only when the user clicks the Update button.
To display the Field List, call the ShowFieldList() method. The following code adds a button that displays the Field List:
@rendermode InteractiveServer

<DxButton Text="Show Field List" Click="OnShowFieldList"/>

<DxPivotTable Data="SalesData" @ref=MyPivotTable>
    <Fields>
        <DxPivotTableField Field="@nameof(Sales.SaleInfo.Region)"
                           Area="@PivotTableArea.Row"
                           AreaIndex="0" />
        <DxPivotTableField Field="@nameof(Sales.SaleInfo.Country)"
                           Area="@PivotTableArea.Row"
                           SortOrder="@PivotTableSortOrder.Descending"
                           AreaIndex="1" />
        <DxPivotTableField Field="@nameof(Sales.SaleInfo.Date)"
                           GroupInterval="@PivotTableGroupInterval.DateYear"
                           Area="@PivotTableArea.Column"
                           AreaIndex="0"
                           Caption="Year" />
        <DxPivotTableField Field="@nameof(Sales.SaleInfo.Date)"
                           GroupInterval="@PivotTableGroupInterval.DateQuarter"
                           Area="@PivotTableArea.Column"
                           AreaIndex="1"
                           Caption="Quarter" />
        <DxPivotTableField Field="@nameof(Sales.SaleInfo.Amount)"
                           SortOrder="@PivotTableSortOrder.Ascending"
                           Area="@PivotTableArea.Data"
                           SummaryType="@PivotTableSummaryType.Sum" />
        <DxPivotTableField Field="@nameof(Sales.SaleInfo.City)"
                           Area="@PivotTableArea.Filter"/>
    </Fields>
</DxPivotTable>

@code {
    IPivotTable MyPivotTable { get; set; }
    IEnumerable<Sales.SaleInfo> SalesData;
    protected override async Task OnInitializedAsync() {
        SalesData = await Sales.GetSalesAsync();
    }
    void OnShowFieldList() {
        MyPivotTable.ShowFieldList();
    }
}
Data Cells, Summaries
Each data cell in the Pivot Table represents a summarized value at the intersection of a Row field and a Column field. Follow the steps below to define data cells.
- Pick a field from your dataset that contains numeric or measurable data (for example,
Quantity,SalesAmount, orPrice). Add this field to the Fields collection and set the Area property toData. - Specify the field’s SummaryType property (an aggregate function).
<DxPivotTable Data="SalesData">
    <Fields>
        @*...*@
        <DxPivotTableField Field="@nameof(Sales.SaleInfo.Amount)"
                           SortOrder="@PivotTableSortOrder.Ascending"
                           Area="@PivotTableArea.Data"
                           SummaryType="@PivotTableSummaryType.Sum" />
    </Fields>
</DxPivotTable>
Commonly used summary types are:
| Summary Type | Description |
|---|---|
| Sum (the default type) |
The sum of field values. This type applies to numeric fields only.  |
| Avg | The average of field values. This type applies to numeric fields only.  |
| Count | The total number of field values. |
| Max | The largest field value. |
| Min | The smallest field value. |
| Other types |
You can use the CellFormat property to specify the display format for data cells.
Totals, Grand Totals
The DevExpress Blazor Pivot Table calculates totals for its data and displays them as separate columns and rows. There are four types of totals:
- Row/column totals display sub-totals calculated for field values that include nested values (Regions and Years in the example below).
- Row/column grand totals display overall totals calculated against all rows/columns.

You can use the following properties to change totals visibility:
The following code hides row and column grand totals:
<DxPivotTable Data="SalesData"
              ShowColumnGrandTotals="false"
              ShowRowGrandTotals="false">
    <Fields>
        @*...*@
    </Fields>
</DxPivotTable>
You can also use the following properties to set the position of row/column totals relative to rows/columns:
The following code changes the position of row and column totals to Before:
<DxPivotTable Data="SalesData"
              RowTotalsPosition="PivotTableRowTotalsPosition.Before"
              ColumnTotalsPosition="PivotTableColumnTotalsPosition.Before">
    <Fields>
        @*...*@
    </Fields>
</DxPivotTable>

Cell Widths
The control applies the following default widths to cells:
- Row fields, row totals, row grand totals: 200 pixels.
- Data fields, corresponding column fields, column totals, column grand totals: 100 pixels.
Use the Width property to set cell widths for fields. The Width property behavior depends on the area where the field is located:
- Row fields: The property sets header cell width.
- Data fields: The property sets data cell width.
- Column fields: If the Pivot Table does not have data fields, the property sets to column header width. Otherwise, the property has no effect.
<DxPivotTable Data="SalesData">
    <Fields>
        <DxPivotTableField Field="@nameof(Sales.SaleInfo.Region)"
                           Area="@PivotTableArea.Row"
                           AreaIndex="0"
                           Width="100"/>
        <DxPivotTableField Field="@nameof(Sales.SaleInfo.Amount)"
                           SortOrder="@PivotTableSortOrder.Ascending"
                           Area="@PivotTableArea.Data"
                           SummaryType="@PivotTableSummaryType.Sum"
                           Width="80"/>
        @*...*@
    </Fields>
</DxPivotTable>