Charts
IMPORTANT
Bootstrap Controls for ASP.NET Core are in maintenance mode. We don’t add new controls or develop new functionality for this product line. Our recommendation is to use the ASP.NET Core Controls suite.
DevExpress Bootstrap Charts are a set of server-side wrappers for JavaScript-based DevExtreme Chart widgets that allow you to use the MVC approach to integrate DevExtreme Charts into your web application. The Bootstrap Chart is a control that visualizes data from a local or remote storage using a great variety of series types along with different interactive elements, such as tooltips, crosshair pointer, a legend, etc.
NOTE
See Online Demos: Refer to the online demos at: https://demos.devexpress.com/aspnetcore-bootstrap/Chart for detailed information on the chart controls’ features and API.
You can use one of these chart types depending on your task:
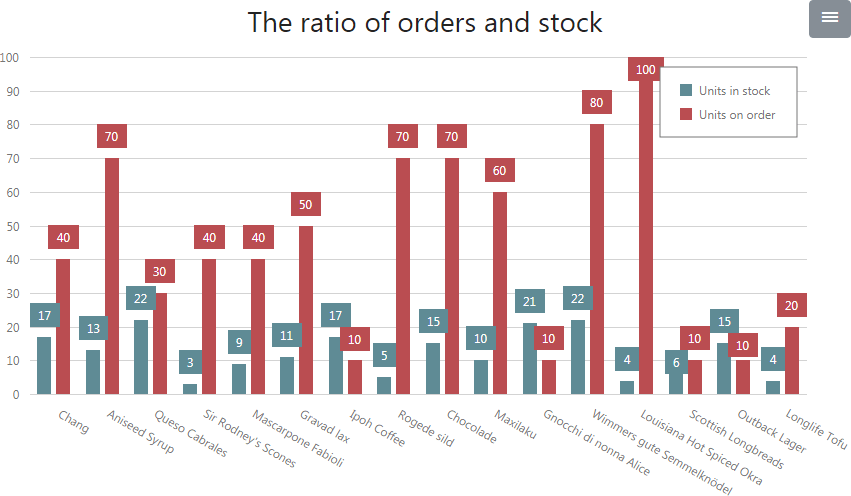
- BootstrapChart to show data in a 2d coordinate system.
- BootstrapPieChart to visualize portions of data as segments in a circle.
- BootstrapPolarChart to represent data in a polar coordinate system.