SnapChart.PaletteName Property
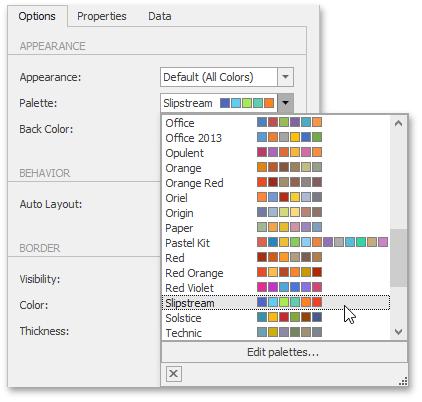
Gets or sets the name of the palette currently used to draw the chart’s series.
Namespace: DevExpress.Snap.Core.API
Assembly: DevExpress.Snap.v21.2.Core.dll
NuGet Package: DevExpress.Snap.Core
Declaration
Property Value
| Type | Description |
|---|---|
| String | A String value which is the palette name. |
Remarks
Use the PaletteName property to select a predefined palette for painting chart series or their individual points. To define a similar palette for chart indicators, use the SnapChart.IndicatorsPaletteName property.

You can also specify a base color for the selected palette using the SnapChart.PaletteBaseColorNumber property.
To learn more, refer to Appearance Customization.
Example
using System;
using System.Data;
using DevExpress.XtraCharts;
using DevExpress.Snap.Core.API;

namespace SnapChartAPI
{
    public partial class Form1 : DevExpress.XtraBars.Ribbon.RibbonForm
    {
        public Form1() {
            InitializeComponent();
            #region #CreateChart
            SnapDocument document = snapControl.Document;
            // Insert a chart into the document.
            SnapChart chart = document.CreateSnChart(document.Range.Start);
            chart.BeginUpdate();
            // Create a data table and bind the chart to it.
            chart.DataSource = CreateChartData();

            // Populate chart series with data.
            chart.SeriesDataMember = "Year";
            chart.SeriesTemplate.ArgumentDataMember = "Region";
            chart.SeriesTemplate.ValueDataMembers.AddRange(new string[] { "Sales" });

            // Specify the series view options.
            chart.SeriesTemplate.ChangeView(ViewType.Bar);
            chart.SeriesNameTemplate.BeginText = "Year: ";

            // Add the chart title.
            ChartTitle chartTitle = new ChartTitle();
            chartTitle.Text = "DevAV Sales by Regions";
            chartTitle.Alignment = System.Drawing.StringAlignment.Center;
            chartTitle.Dock = ChartTitleDockStyle.Top;
            chart.Titles.Add(chartTitle);

            // Add the value axis title.
            XYDiagram diagram = (XYDiagram)chart.Diagram;
            diagram.AxisY.Title.Visibility = DevExpress.Utils.DefaultBoolean.True;
            diagram.AxisY.Title.Alignment = System.Drawing.StringAlignment.Center;
            diagram.AxisY.Title.Text = "Millions of Dollars";

            // Set the chart size.
            chart.Size = new System.Drawing.Size(640, 425);
            chart.UseExplicitSize = true;

            // Change the chart palette.
            chart.PaletteName = "Slipstream";
            chart.EndUpdate();

            document.Fields.Update();
            #endregion #CreateChart
        }

        #region #CreateDataSource
        DataView CreateChartData() {
            int prevYear = DateTime.Now.Year - 1;

            // Create a data table.
            DataTable table = new DataTable("ChartData");

            // Add three columns to the table.
            table.Columns.Add("Year", typeof(int));
            table.Columns.Add("Region", typeof(string));
            table.Columns.Add("Sales", typeof(decimal));

            // Add data rows to the table.
            table.Rows.Add(prevYear - 2, "Asia", 4.2372D);
            table.Rows.Add(prevYear - 2, "Australia", 1.7871D);
            table.Rows.Add(prevYear - 2, "Europe", 3.0884D);
            table.Rows.Add(prevYear - 2, "North America", 3.4855D);
            table.Rows.Add(prevYear - 2, "South America", 1.6027D);

            table.Rows.Add(prevYear - 1, "Asia", 4.7685D);
            table.Rows.Add(prevYear - 1, "Australia", 1.9576D);
            table.Rows.Add(prevYear - 1, "Europe", 3.3579D);
            table.Rows.Add(prevYear - 1, "North America", 3.7477D);
            table.Rows.Add(prevYear - 1, "South America", 1.8237D);

            table.Rows.Add(prevYear, "Asia", 5.2890D);
            table.Rows.Add(prevYear, "Australia", 2.2727D);
            table.Rows.Add(prevYear, "Europe", 3.7257D);
            table.Rows.Add(prevYear, "North America", 4.1825D);
            table.Rows.Add(prevYear, "South America", 2.1172D);

            return new DataView(table);
        }
        #endregion #CreateDataSource
    }
}
See Also