ChartObject.SelectData(CellRange, ChartDataDirection) Method
Specifies the source data for the chart.
Namespace: DevExpress.Spreadsheet.Charts
Assembly: DevExpress.Spreadsheet.v25.1.Core.dll
NuGet Package: DevExpress.Spreadsheet.Core
Declaration
Parameters
| Name | Type | Description |
|---|---|---|
| range | CellRange | A continuous cell range that contains chart data. |
| direction | ChartDataDirection | A ChartDataDirection enumeration member that specifies how to retrieve series values: from rows or columns. |
Remarks
The SelectData method retrieves data series from the specified range and automatically determines the Series.SeriesName, Series.Arguments and Series.Values for each series. The direction parameter specifies in which direction the series are retrieved.
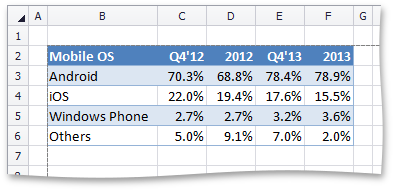
This example demonstrates how to create a chart and specify its data using the ChartObject.SelectData method.
The data range looks as follows.
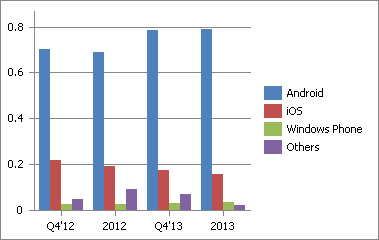
The direction in which the data are extracted is specified by the parameter passed to the method. If the direction equals the ChartDataDirection.Row value, the following chart is displayed.
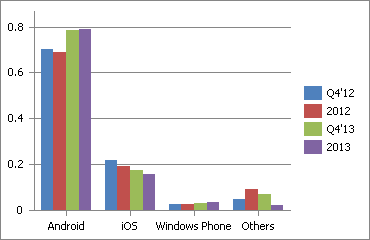
If the direction equals the ChartDataDirection.Column value, the chart looks as follows.
Worksheet worksheet = workbook.Worksheets["chartTask3"];
workbook.Worksheets.ActiveWorksheet = worksheet;

// Create a chart and specify its location.
Chart chartRowData = worksheet.Charts.Add(ChartType.ColumnClustered);
chartRowData.TopLeftCell = worksheet.Cells["D3"];
chartRowData.BottomRightCell = worksheet.Cells["I14"];

// Select chart data by rows.
chartRowData.SelectData(worksheet["B2:F6"], ChartDataDirection.Row);

// Create a chart and specify its location.
Chart chartColumnData = worksheet.Charts.Add(ChartType.ColumnClustered);
chartColumnData.TopLeftCell = worksheet.Cells["K3"];
chartColumnData.BottomRightCell = worksheet.Cells["N14"];

// Select chart data by columns.
chartColumnData.SelectData(worksheet["B2:F6"], ChartDataDirection.Column);
Instead of specifying the ChartDataDirection parameter in the SelectData method, you can use the ChartObject.SwitchRowColumn method to change the way that data rows and columns are plotted.
Related GitHub Examples
The following code snippets (auto-collected from DevExpress Examples) contain references to the SelectData(CellRange, ChartDataDirection) method.
Note
The algorithm used to collect these code examples remains a work in progress. Accordingly, the links and snippets below may produce inaccurate results. If you encounter an issue with code examples below, please use the feedback form on this page to report the issue.