Hints
- 5 minutes to read
A hint is a small pop-up rectangle that shows information about a tapped series or point. A chart can display its hints as tooltips for all charts and as a Crosshair Cursor for a Cartesian Chart. A tooltip can display a beak which indicates its data point:
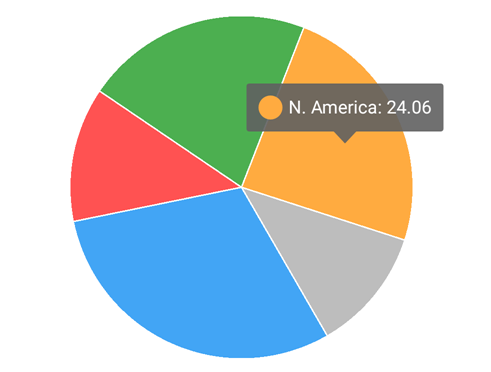
In this guide, the tooltip is used to show common hint features.
How to: Allow end users to show hints
End-users can show or hide a tooltip by tapping a series or series point.
The following code demonstrates how to enable hints:
The table below contains symbols that configure the end-user capability to show tooltips:
| Symbol | Description |
|---|---|
| Hint | The Chart hint-related settings’ storage. |
| PieHint | A pie hint. |
| HintBase.setEnabled(boolean) | Specifies the value that indicates whether hints are enabled. |
| Chart.setHint(Hint) | Specifies the chart hint settings. |
| PieChart.setHint(PieHint) | Specifies a PieHint object that stores a Pie chart’s hint-related settings. |
How to: Configure a series representation in a hint
You can disable an individual series’ hints, specify a text pattern to format values, and arrange these values within tooltips.
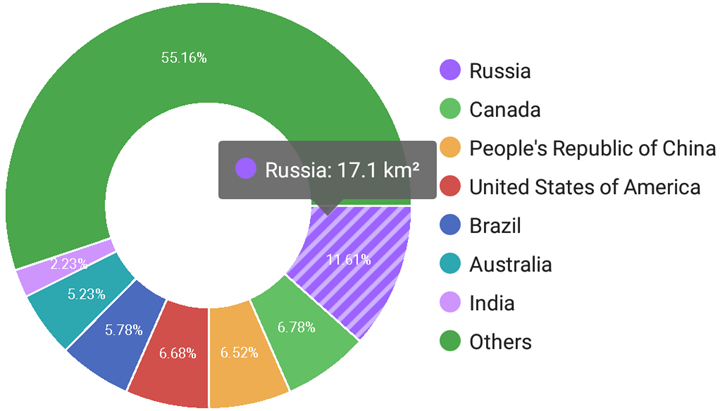
The code below shows how to specify a tooltip text’s pattern.
PieSeriesHintOptions hintOptions = new PieSeriesHintOptions();
hintOptions.setPointTextPattern("{L}: {V} km²");
pieSeries.setHintOptions(hintOptions);
The following symbols configure series and hint interaction:
| Symbol | Description |
|---|---|
| PieSeries.setHintOptions(PieSeriesHintOptions) | Specifies the PieSeriesHintOptions object that stores hint settings. |
| PieSeriesHintOptions | The Pie series hint options storage. |
| Series.setHintOptions(SeriesHintOptions) | Specifies the SeriesHintOptions object that specifies a series’s hint text parameters. |
| SeriesHintOptions | The series’s hint options storage. |
| SeriesCrosshairOptions | The series’ Crosshair settings storage. |
Note
You should use the SeriesHintOptions class for a Pie series and a Cartesian series within a Cartesian Chart that uses tooltips; in other cases you should use SeriesCrosshairOptions.
In the code above, the series placeholders (L and V) specify which series point values a tooltip should display in its text. The following label placeholders are available:
| Placeholder | Description |
|---|---|
| {S} | Displays a series name. |
| {A} | Displays a series point argument. |
| {L} | Displays a pie series point label. |
| {V} | Displays a series point value. |
| {VP} | Displays a series point value as percentages. |
| {W} | Displays a Bubble series point weight. |
| {O} | Displays a financial series point open value. |
| {H} | Displays a financial series point high value. |
| {L} | Displays a financial series point low value. |
| {C} | Displays a financial series point close value. |
| {HV} | Displays a range bar series point max value. |
| {LV} | Displays a range bar series point min value. |
Note
These values can be formatted using default format strings after the $ sign.
For example, in the {VP$#.##} string, VP is a placeholder, $ is a format string separator, and #.## is a format string.
How to: Show or hide tooltip programmatically
The chart can show or hide hints programmatically. The chart listener can also perform certain actions when a chart shows or hides a hint. For example, the following code demonstrates how to show the hint in the connected second chart when the first chart shows its hint using the chart delegate:
chart1.setHintListener(new ChartHintListener(chart2));
chart2.setHintListener(new ChartHintListener(chart1));
// The ChartHintListener implementation.
static class ChartHintListener implements HintListener{
Chart mConnectedChart;
public ChartHintListener(Chart connectedChart){
mConnectedChart = connectedChart;
}
@Override
public void onShow(HintInfo hintInfo) {
mConnectedChart.showHint(hintInfo.getScreenPoint());
}
@Override
public void onHide() {
mConnectedChart.hideHint();
}
}
The table below contains members that are the chart tooltip API.
| Symbol | Description |
|---|---|
| HintListener | Listener for receiving events when a hint is shown or hidden. |
| ChartBase.showHint(int, int) | Shows a hint for the specified data point. |
| ChartBase.showHint(Point) | Shows a hint for the specified point. |
| ChartBase.hideHint() | Listener for receiving events when a hint is shown or hidden. |
How to: Customize a tooltip’s appearance
You can customize a chart’s tooltip appearance using the following highlighted parameters:
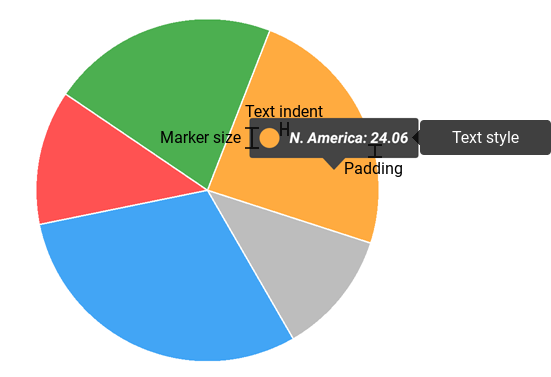
The following code demonstrates how to configure the tooltip’s appearance:
Hint hint = new Hint();
hint.setEnabled(true);
chart.setHint(hint);
HintStyle hintStyle = new HintStyle();
hintStyle.setMarkerSize(40);
hintStyle.setBackgroundColor(Color.DKGRAY);
hintStyle.setTextIndent(20);
hintStyle.setPadding(20,20,20,20);
hint.setStyle(hintStyle);
TextStyle textStyle = new TextStyle();
textStyle.setSize(30f);
textStyle.setColor(Color.WHITE);
textStyle.setPaintFlags(Paint.ANTI_ALIAS_FLAG);
textStyle.setLocale(Locale.US);
textStyle.setTypeface(Typeface.defaultFromStyle(Typeface.BOLD_ITALIC));
hintStyle.setTextStyle(textStyle);
The symbols below specify the tooltip’s appearance.
| Symbol | Description |
|---|---|
| HintStyle | Hint’s appearance settings storage.com.devexpress.dxcharts.HintStyle)] |
| Hint.getStyle() | Returns the HintStyle object that specifies a hint’s appearance settings. |
| Hint.setStyle(HintStyle) | Specifies the HintStyle object that defines a hint’s appearance settings. |
| PieHintStyle | The pie hint’s appearance settings. |
| PieHint.getStyle() | Returns a PieHintStyle object that specifies a hint’s style. |
| PieHint.setStyle(PieHintStyle) | Specifies a PieHintStyle object that specifies a hint’s style. |