IDashboardControl.DashboardItemControlCreated Event
Allows you to access underlying WinForms controls.
Namespace: DevExpress.DashboardWin
Assembly: DevExpress.Dashboard.v25.1.Win.dll
NuGet Package: DevExpress.Win.Dashboard
Declaration
Event Data
The DashboardItemControlCreated event's data class is DashboardItemControlEventArgs. The following properties provide information specific to this event:
| Property | Description |
|---|---|
| CardControl | Gets an underlying Card control. |
| ChartContext | Gets the chart context. |
| ChartControl | Gets an underlying chart control. |
| DashboardItemName | Gets the component name of the dashboard item for which the event was raised. |
| DateFilterControl | Gets an underlying date filter control. |
| GaugeContext | Gets the gauge context. |
| GaugeControl | Gets an underlying gauge control. |
| GridContext | Gets the grid context. |
| GridControl | Gets an underlying grid control. |
| MapControl | Gets an underlying map control. |
| PictureEdit | Gets an underlying picture edit control. |
| PivotGridControl | Gets an underlying PivotGridControl. |
| RichEditControl | Gets an underlying RichEdit control. |
| TreeMapControl | Gets an underlying TreeMap control. |
Example
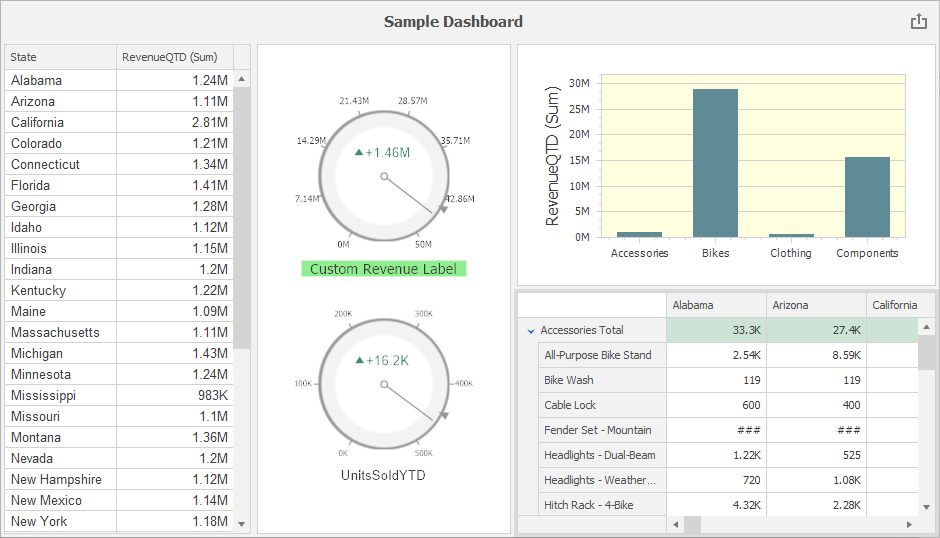
The following code snippets shows how to customize the controls used to visualize data in the dashboard items at runtime.

The following options are changed:
- Grid: The font is changed to “Arial, 10”. For this, handle the DashboardDesigner.DashboardItemControlUpdated event and access the control’s MainView.
- Chart: The background color of the chart pane is set to LightYellow. For this, handle the DashboardDesigner.DashboardItemControlUpdated event and access the control’s Diagram property.
- Pivot: Cell values related to “Mountain” products are hidden, ### is displayed instead. The PivotGridControl.CustomCellValue, DashboardDesigner.DashboardItemControlCreated and DashboardDesigner.DashboardItemBeforeControlDisposed events are handled to customize the cell values.
- Gauge: The background color of the first gauge’s label is set to “LightGreen”, a custom label is set and displayed in “Tahoma, 16” font. The number of major ticks is set to 8. For this, handle the DashboardDesigner.DashboardItemControlUpdated event and use the Gauges property to access the collection of gauges displayed in the control.
using DevExpress.XtraCharts;
using DevExpress.XtraGauges.Core.Drawing;
using DevExpress.XtraGauges.Win.Gauges.Circular;
using DevExpress.XtraGrid.Views.Grid;
using DevExpress.XtraPivotGrid;
using System.Drawing;

namespace DashboardDesigner_ControlAccess
{
    public partial class DesignerForm1: DevExpress.XtraBars.Ribbon.RibbonForm
    {
        public DesignerForm1() {
            InitializeComponent();
            dashboardDesigner.CreateRibbon();
            dashboardDesigner.LoadDashboard(@"..\..\Dashboards\dashboard1.xml");
        }

        private void dashboardDesigner_DashboardItemControlCreated(object sender, DevExpress.DashboardWin.DashboardItemControlEventArgs e) {
            // For all Pivot items in the dashboard:
            if (e.PivotGridControl != null) {
                PivotGridControl pivotGridControl = e.PivotGridControl;
                pivotGridControl.CustomCellValue += PivotGridControl_CustomCellValue; ;
            }
        }

        private void PivotGridControl_CustomCellValue(object sender, PivotCellValueEventArgs e) {
            if (e.RowField == null) return;
            if (e.GetFieldValue(e.RowField).ToString().Contains("Mountain"))
                e.Value = "###";
        }

        private void dashboardDesigner_DashboardItemControlUpdated(object sender, DevExpress.DashboardWin.DashboardItemControlEventArgs e) {
            // For all Grid items in the dashboard:
            if(e.GridControl!= null) {
                GridView gridView = e.GridControl.MainView as GridView;
                gridView.Appearance.Row.Font = new Font("Arial", 10);
            }
            // For a specific Chart item in the dashboard:
            if(e.DashboardItemName == "chartDashboardItem1") {
                ChartControl chartControl = e.ChartControl;
                ((XYDiagram)chartControl.Diagram).Panes[0].BackColor = Color.LightYellow;
            }
            // For a specific Gauge item in the dashboard:
            if (e.DashboardItemName == "gaugeDashboardItem1") {
                var gauge = e.GaugeControl.Gauges[0] as CircularGauge;
                gauge.Labels[0].AppearanceBackground.ContentBrush = new SolidBrushObject(Color.LightGreen);
                gauge.Labels[0].Text = "Custom Revenue Label";
                gauge.Labels[0].AppearanceText.Font = new Font("Tahoma", 16);
                gauge.Scales[0].MajorTickCount = 8;
            }
        }

        private void dashboardDesigner_DashboardItemBeforeControlDisposed(object sender, DevExpress.DashboardWin.DashboardItemControlEventArgs e) {
            if(e.PivotGridControl != null) {
                PivotGridControl pivotGridControl = e.PivotGridControl;
                pivotGridControl.CustomCellValue -= PivotGridControl_CustomCellValue;
            }
        }
    }
}
See Also