Dimension Column
- 2 minutes to read
A dimension column displays grouped values from a bound data item and allows you to provide discrete categorical information.
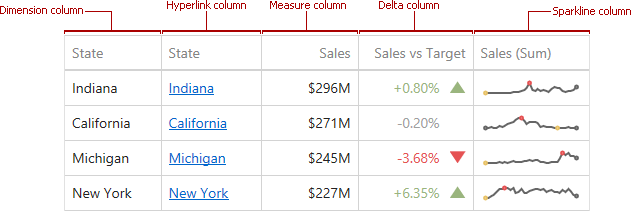
Use the following icon in the data item menu to specify a dimension column:
![]()
Data Types
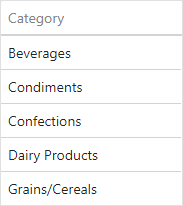
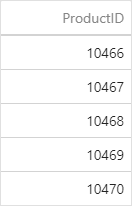
A dimension column accepts values of any type:
Type | Example | Description |
|---|---|---|
string |
| Displays string values. |
numeric |
| Displays numeric (integer or float) values. |
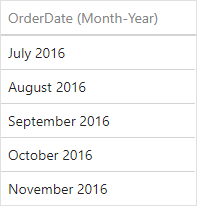
date |
| Displays date-time values. For these values, you can change a group interval. Open the relevant data item’s menu and use the Group Interval property in the Binding group. |
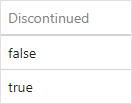
boolean |
| Displays boolean values as true or false. |
object |
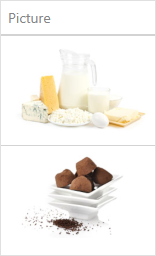
| The dimension column can display images if it is bound to a data source containing images. You can choose whether the dimension column shows data as images or text (strings that encode images in the base64 format). To do this, open the relevant data item’s menu and use the Display Mode property in the Options group. |
In any case, the dashboard does not summarize the dimension values, but groups identical values.
API
In code, dimension columns are represented by the the GridDimensionColumn class. Use the following properties to change column options:
Specifies a dimension that provides cell values. | |
Specifies how to display cell values. |
