Troubleshooting - Get Started
- 3 minutes to read
This section describes how to determine whether the error occurs on the server or client.
Diagnose Server-Side Errors
The following messages indicate that an application fails to process the request on the server:
Alert message: “Callback request failed due to an internal server error”.
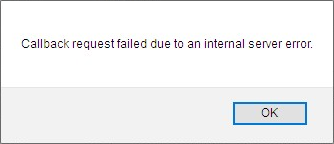
The browser console message: “500 Internal Server Error”.

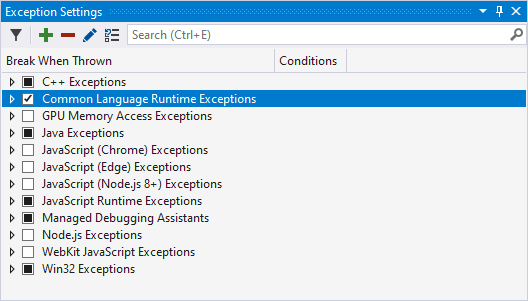
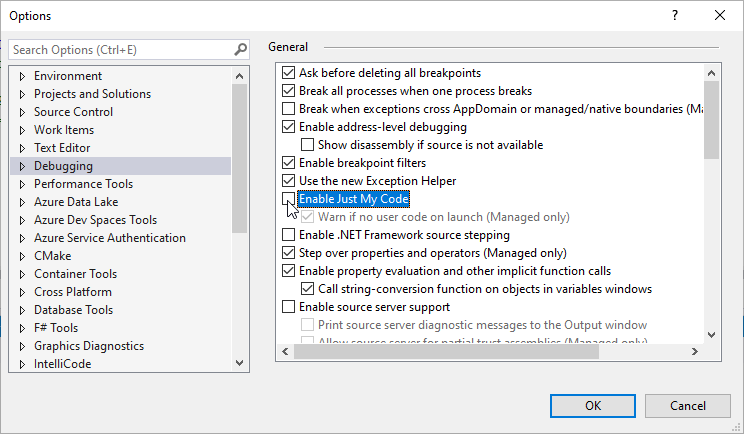
These errors may provide insufficient information about a server-side exception. In Visual Studio, follow the steps below to enable exceptions when you run a project in Debug mode:
Enable the Common Language Runtime Exceptions option in the Debug | Windows | Exception Settings window.
Disable the Enable Just My Code (Managed Only) option in the Tools | Options dialog’s Debugging node.
You can also open the Call Stack window from the Debug | Windows Visual Studio menu item to see the code that causes the issue.
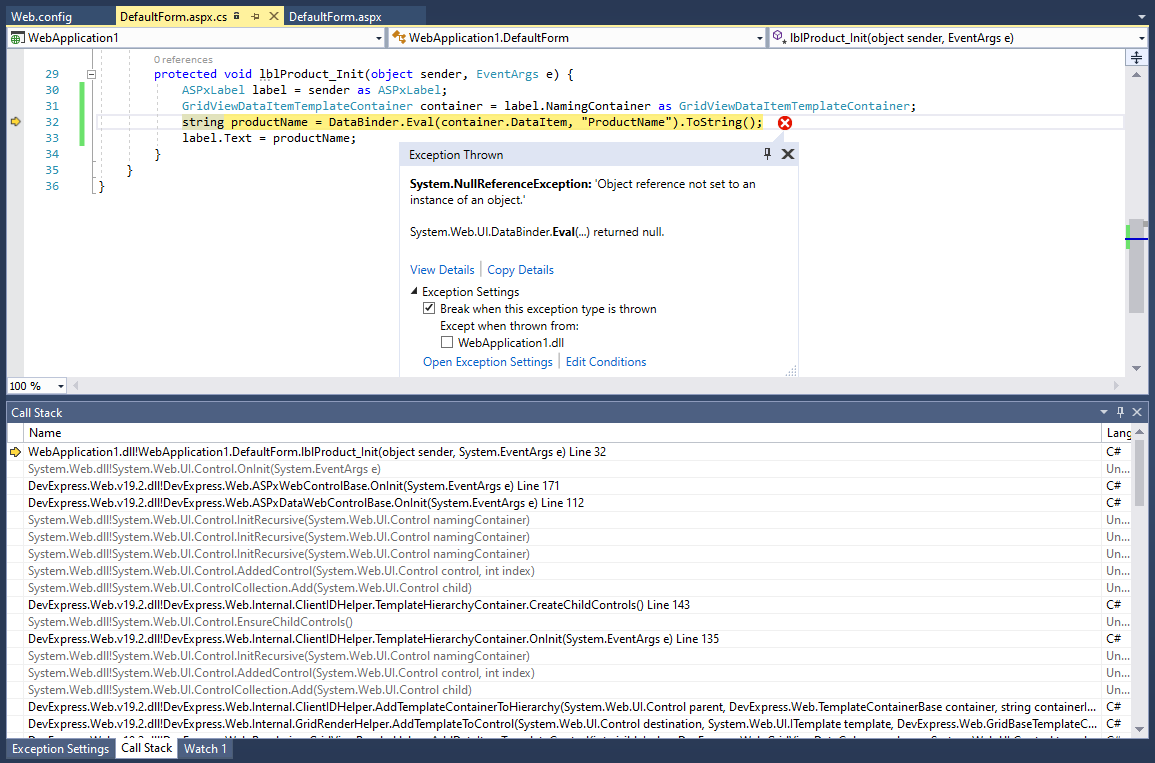
The call stack highlights the line of code (API member) where the exception occurs. If this exception relates to the System libraries, try to search for a solution on the Internet. Use the Server-Side Issues section to find a solution if the call stack points to an issue in our code.
Use any of the following options to get detailed error messages if an error occurs on the production server:
Disable the customErrors option in the web.config file.
<system.web>
    <customErrors mode="Off">
    </customErrors>
</system.web>
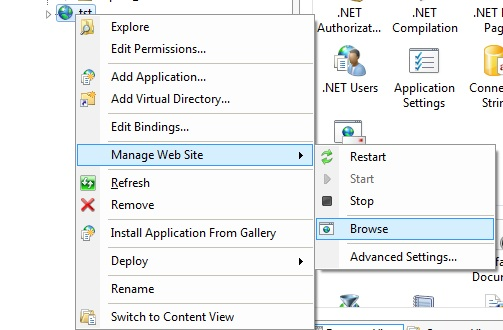
Run your application on your IIS server in Browse mode or enable the Detailed errors option as described in the following KB article: Internal Server Error.
If an error occurs on callback, handle the CallbackError event in the Global.asax file to delegate callback exception handling to the Application_Error event. In this event handler, you can obtain and log exception details. Refer to the following help topic for information on how to handle callback exceptions:
void Application_Start(object sender, EventArgs e) {
    // Assign Application_Error as a callback error handler for DevExpress ASP.NET MVC extensions
    ASPxWebControl.CallbackError += new EventHandler(Application_Error);
}

void Application_Error(object sender, EventArgs e) {
    // Use HttpContext.Current to get a Web request processing helper
    HttpServerUtility server = HttpContext.Current.Server;
    Exception exception = server.GetLastError();
    if (exception is HttpUnhandledException)
        exception = exception.InnerException;
    // Log an exception
    AddToLog(exception.Message, exception.StackTrace);
}

void AddToLog(string message, string stackTrace) {
    StringBuilder sb = new StringBuilder();
    sb.AppendLine(DateTime.Now.ToLocalTime().ToString());
    sb.AppendLine(message);
    sb.AppendLine();
    sb.AppendLine("Source File: " + HttpContext.Current.Request.RawUrl);
    sb.AppendLine();
    sb.AppendLine("Stack Trace: ");
    sb.AppendLine(stackTrace);
    for (int i = 0; i < 150; i++)
        sb.Append("-");
    sb.AppendLine();
    HttpContext.Current.Session["Log"] += sb.ToString();
    sb.AppendLine();
}
Use that information to find the solution in our Server-Side Issues section.
Diagnose Client-Side Errors
The following error types are related to issues on the client:
An extension hangs while processing a request.
The loading panel hangs.
You can use the Developer Tools to trace client-side errors and get more information about them. The list below provides links to detailed instructions on how to access the Developer Tools in different browsers:
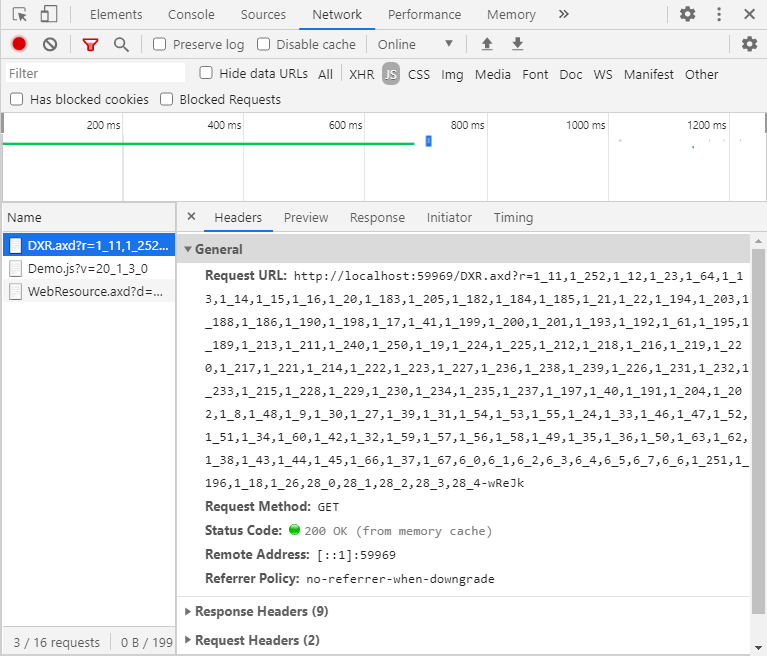
Open the Developer Tools (F12 in Chrome) and watch the “Console” tab. Red lines indicate that the application has JavaScript exceptions. You can double-click a method that breaks code execution to refer to its definition.

Use the “Network” tab to review whether all resources are loaded correctly on a response from the server. You can refer to the HttpStatusCode to review status codes defined for HTTP.
Use that information to find the solution in our Client-Side Issues section.