Hints
- 6 minutes to read
A hint is a small pop-up rectangle that shows information about a tapped series or point. A chart can display its hints as tooltips for all charts and as a Crosshair Cursor for a Cartesian Chart. A tooltip can display a beak which indicates its data point.

In this guide, the tooltip is used to show hint features.
How to: Allow end users to show hints
Assign a new Hint instance to the hint property to enable hints for a chart:

The following code demonstrates how to enable hints:
self.chart.hint = [[DXHint alloc] init];
The code above uses the following symbols:
| Symbol | Description |
|---|---|
| DXChart.hint | Gets or sets the Chart’s interactive hint settings. |
| DXHint | The Chart’s interactive hint settings storage. |
| DXPieChart.hint | Gets or sets the Pie Chart’s interactive hint settings. |
| DXPieHint | The Pie Chart’s interactive hint settings storage. |
Note
The hint type should be compatible with a chart to which you set it.
How to: Configure a series representation in a hint
You can disable an individual series’ hints, specify a text pattern to format values, and arrange these values within tooltips.

The code below shows how to specify a tooltip text’s pattern.
DXPieSeriesHintOptions* hintOptions = [[DXPieSeriesHintOptions alloc] init];
hintOptions.pointTextPattern = @"{L}: {V$#.##} millions of km²";
pieSeries.hintOptions = hintOptions;
The following symbols configure series and hint interaction:
| Symbol | Description |
|---|---|
| DXPieSeries.hintOptions | Gets or sets pie series’ hint options. |
| DXPieSeriesHintOptions | The pie series’ hint options storage. |
| DXSeries.hintOptions | Gets or sets the series’s hint options. |
| DXSeriesHintOptions | The series’s tooltip options storage. |
| DXSeriesCrosshairOptions | The series’s Crosshair options storage. |
Note
You should use the DXSeriesHintOptions class for a Pie series and a Cartesian series within a Cartesian Chart that uses tooltips; in other cases you should use DXSeriesCrosshairOptions.
In the code above, the series placeholders (L and V) specify which series point values a tooltip should display in its text. The following label placeholders are available:
| Placeholder | Description |
|---|---|
| {S} | Displays a series name. |
| {A} | Displays a series point argument. |
| {L} | Displays a pie series point label. |
| {V} | Displays a series point value. |
| {VP} | Displays a series point value as percentages. |
| {W} | Displays a Bubble series point weight. |
| {O} | Displays a financial series point open value. |
| {H} | Displays a financial series point high value. |
| {L} | Displays a financial series point low value. |
| {C} | Displays a financial series point close value. |
| {HV} | Displays a range bar series point max value. |
| {LV} | Displays a range bar series point min value. |
Note
These values can be formatted using default format strings after the $ sign.
For example, in the {VP$#.##} string, VP is a placeholder, $ is a format string separator, and #.## is a format string.
How to: Programmatically interact with a hint
The chart provides methods that show or hide the hint programmatically. The chart delegate allows you to track when a chart shows or hides the hint. For example, the following code shows a hint programmatically and notifies event listeners when end users invoke hints:
@class LandAreaChartController;
@protocol LandAreaChartControllerDelegate
-(void) controller: (LandAreaChartController *)controller selectionDidChange: (LandAreaItem *)selectedItem;
@end

@interface LandAreaChartController : UIViewController<DXChartDelegate>
readwrite, nonatomic, weak, nullable id<LandAreaChartControllerDelegate> delegate;
@property IBOutlet DXPieChart *pieChart;
readwrite NSArray<LandAreaItem *> *landAreas;

-(void) showHintForItem: (LandAreaItem *)item;
@end


@implementation LandAreaChartController
- (void) viewDidLoad {
    self.pieChart.delegate = self;
}

- (void)chart:(DXChartBase *)chart didShowHint:(DXHintInfo *)info {
    if (self.delegate != nil) {
        NSNumber *itemIndex = [[info.seriesPointInfos objectAtIndex:0].dataPointIndices objectAtIndex:0];
        LandAreaItem *item = [self.landAreas objectAtIndex:itemIndex.unsignedIntegerValue];
        [self.delegate controller: self selectionDidChange:item];
    }
}

- (void)chartDidHideHint:(DXChartBase *)chart {
    [self.delegate controller: self selectionDidChange:nil];
}

- (void) showHintForItem:(LandAreaItem *)item {
    NSUInteger itemIndex = [self.landAreas indexOfObject:item];
    if (itemIndex != NSNotFound) {
        [self.pieChart showHintForPointWithIndex:itemIndex ofSeriesWithIndex:0];
    } else {
        [self.pieChart hideHint];
    }
}
@end
The table below contains members the chart tooltip API includes.
Member | Description |
|---|---|
Shows an interactive hint (Tooltip or Crosshair Cursor) at the specified point on a chart. | |
Shows a hint for the specified data point. | |
Hides the displayed hint. | |
The action that should be done on hint showing. | |
The action that should be done on hint hiding. |
How to: Customize a tooltip’s appearance
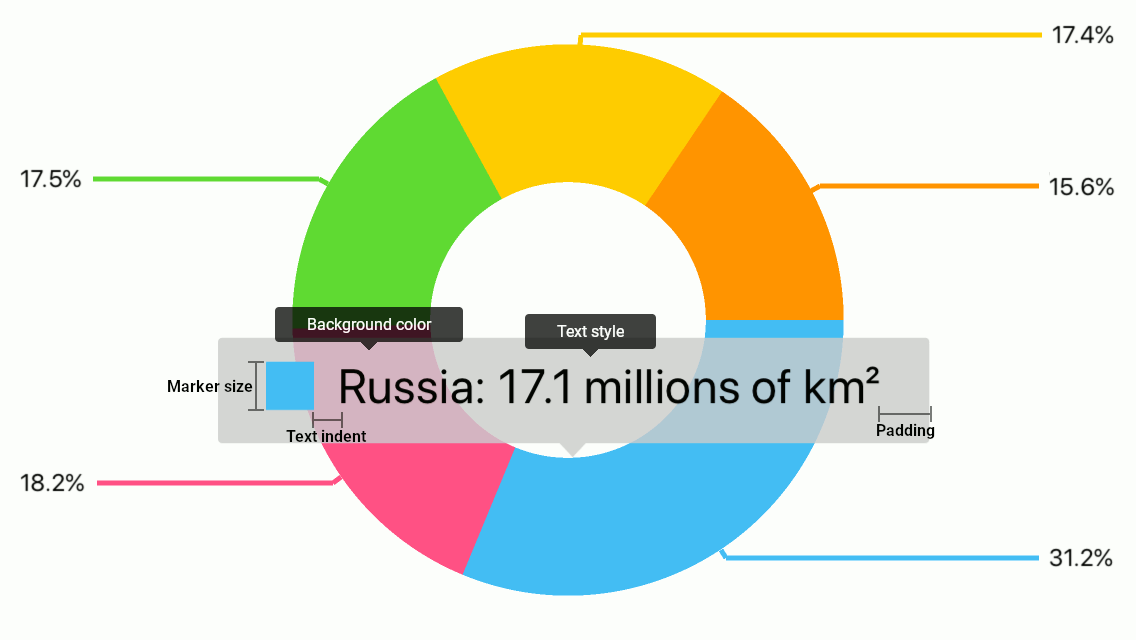
You can customize a chart’s tooltip appearance using the following highlighted parameters:

The following code demonstrates how to configure the tooltip’s appearance:
// All sizes are in screen points.
DXPieHint *hint = [[DXPieHint alloc] init];
DXHintStyle *hintStyle = [[DXHintStyle alloc] init];
DXTextStyle *hintTextStyle = [[DXTextStyle alloc] init];

self.pieChart.hint = hint;
hint.style = hintStyle;
hintStyle.textStyle = hintTextStyle;

hintStyle.backgroundColor = [UIColor colorWithWhite:0.8f alpha: 0.8f];
hintStyle.padding = UIEdgeInsetsMake(12.0f, 24.0f, 12.0f, 24.0f);
hintStyle.markerSize = 24;
hintStyle.textIndent = 12;

hintTextStyle.foregroundColor = UIColor.blackColor;
hintTextStyle.fontSize = 24;
The symbols below specify the tooltip’s appearance.
| Symbols | Description |
|---|---|
| DXHint.style | Gets or sets the Cartesian Chart’s hint appearance settings. |
| DXHintStyle | The Cartesian Chart hint’s appearance settings storage. |
| DXPieHint.style | Gets or sets a Pie Chart’s hint appearance settings. |
| DXPieHintStyle | The Pie Chart hint’s appearance settings storage. |