Cartesian Chart
- 5 minutes to read
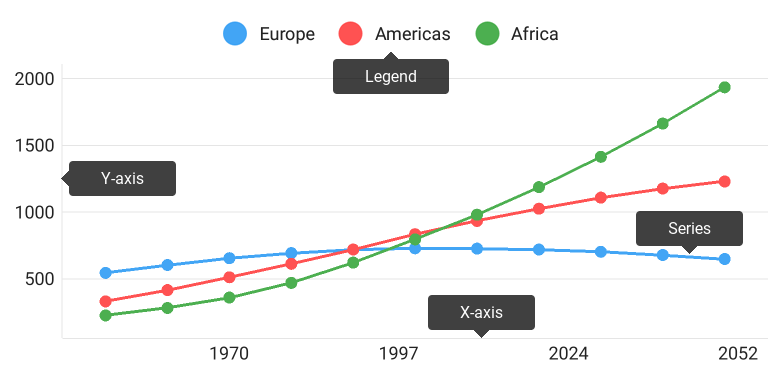
The DevExpress Chart allows you to visualize your data in a Cartesian chart. The image below shows a Cartesian chart and highlights its major elements:

This guide describes specific operations the Chart can perform.
How to: Modify chart series
The Chart visualizes data the series provides. Each series defines data appearance and behavior. Series, compatible with the Chart View, inherits the Series class.
Note that chart should be populated with data. Refer to the Series guide for more information.
The following code snippet shows how to add a series to a chart:
LineSeries lineSeries = new LineSeries();
lineSeries.setDisplayName("US");
lineSeries.setData(new GdpData(points));

mChart.addSeries(lineSeries);
//...
class GdpData implements NumericSeriesData {
    List<Gdp> gdps = new ArrayList<>();

    public  GdpData(Gdp... points) {
        for (Gdp point : points) gdps.add(point);
    }
    @Override
    public int getDataCount() {
        return gdps.size();
    }
    @Override
    public double getArgument(int i) {
        return gdps.get(i).getYear();
    }
    @Override
    public double getValue(int i) {
        return gdps.get(i).getProduct();
    }
}
The following table contains methods allowing you to obtain, add or remove series of the chart:
| Method | Description |
|---|---|
| Chart.getSeries() | Returns the array of series that the chart displays. |
| Chart.addSeries(Series) | Adds the specified new series to the chart. |
| Chart.removeSeries(Series) | Removes the specified series from the chart. |
How to: Manage chart axes
In addition to series, chart contains elements allowing you to configure how it looks and behaves. Axes are responsible for the coordinate space the chart visualize.
The following example demonstrates how to customize chart axes:
QualitativeAxisX xAxis = new QualitativeAxisX();
xAxis.setRange(new QualitativeRange("A", "Z"));
mChart.setAxisX(xAxis);

NumericAxisY yAxis = new NumericAxisY();
yAxis.setGridAlignment(1.0);
yAxis.setAlwaysShowZeroLevel(false);
mChart.setAxisY(yAxis);
The table below contains the main symbols for configuring chart axes:
| Symbol | Description |
|---|---|
| Chart.getAxisX() | Returns the chart’s X-axis. |
| Chart.setAxisX(AxisX) | Specifies the chart’s X-axis. |
| Chart.getAxisY() | Returns the chart’s Y-axis. |
| Chart.setAxisY(NumericAxisY) | Specifies the chart’s Y-axis. |
| QualitativeAxisX | The arguments axis that manages representation of series with QualitativeSeriesData data. |
| NumericAxisX | The arguments axis that manages representation of series with NumericSeriesData data. |
| DateTimeAxisX | The arguments axis that manages representation of series with DateTimeSeriesData or FinancialSeriesData data. |
| NumericAxisY | The values axis that manages representation of series with NumericData data. |
Refer to the Axes guide for more information about axes configuration.
How to: Synchronize multiple charts
You can scroll and zoom several charts simultaneously by synchronizing their axes ranges. These axes should have the same scale type and the ChartSynchronizer object assigned.
ChartSynchronizer synchronizer = new ChartSynchronizer();

DateTimeAxisX chart1AxisX = new DateTimeAxisX();
chart1AxisX.setSynchronizer(synchronizer);
chart1.setAxisX(chart1AxisX);

DateTimeAxisX chart2AxisX = new DateTimeAxisX();
chart2AxisX.setSynchronizer(synchronizer);
chart2.setAxisX(chart2AxisX);
The code uses the following symbols:
| Symbol | Description |
|---|---|
| ChartSynchronizer | A synchronization marker. |
| AxisBase.setSynchronizer(ChartSynchronizer) | Specifies a ChartSynchronizer object that indicates if the axis range should be synchronized. |
How to: Configure the chart legend
The Legend identifies series in a chart. The following example demonstrates the basic legend configuration:
Legend legend = new Legend();
legend.setOrientation(LegendOrientation.HORIZONTAL);
legend.setHorizontalPosition(LegendHorizontalPosition.CENTER);
legend.setVerticalPosition(LegendVerticalPosition.TOP_OUTSIDE);
legend.setVisible(true);
mChart.setLegend(legend);
The table below contains the main methods for configuring legend:
| Method | Description |
|---|---|
| ChartBase.getLegend() | [!summary-include(com.devexpress.dxcharts.ChartBase.getLegend) |
| ChartBase.setLegend(Legend) | Specifies the chart legend‘s options. |
| Legend | The legend of the chart. |
Refer to the Legend guide for more information about legend configuration.
How to: Scroll and zoom
In addition to common interactivity capabilities, the Cartesian Chart allows end-users to navigate on the chart coordinate space:

The following code example demonstrates how to enable zooming and scrolling along the X axis and disable navigation along the Y axis, like on the image above.
mChart.setAxisXNavigationMode(AxisNavigationMode.SCROLLING_AND_ZOOMING);
mChart.setAxisYNavigationMode(AxisNavigationMode.NONE);
The code above uses the following methods:
| Method | Description |
|---|---|
| Chart.getAxisXNavigationMode() | Returns the X-axis’s navigation mode. |
| Chart.setAxisXNavigationMode(AxisNavigationMode) | Specifies the X-axis’s navigation mode. |
| Chart.getAxisYNavigationMode() | Returns the Y-axis’s navigation mode. |
| Chart.setAxisYNavigationMode(AxisNavigationMode) | Specifies the Y-axis’s navigation mode. |
| AxisNavigationMode | Lists values specifying possible axis navigation modes. |
How to: Change chart appearance
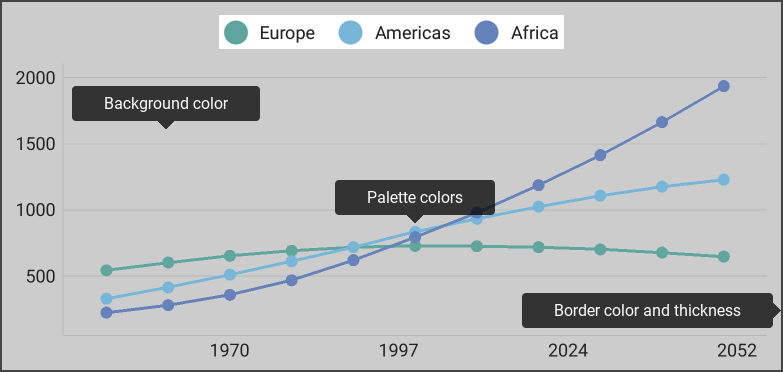
Appearance of all chart elements including the Chart can be changed using styles. The following image demonstrates which chart parameters can be styled:

The following code snippet demonstrates how to obtain the image above:
ChartStyle chartStyle = new ChartStyle();
chartStyle.setBorderColor(Color.DKGRAY);
chartStyle.setBorderThickness(2.0f);
chartStyle.setBackgroundColor(Color.LTGRAY);
chartStyle.setPalette(new int[] {0xff60a69f, 0xff78b6d9, 0xff6682bb});
mChart.setStyle(chartStyle);
The following symbols allow you to configure chart style:
Symbol | Description |
|---|---|
Chart.getStyle() |Returns the chart’s style. | |
Chart.setStyle(ChartStyle) |Specifies the chart’s style. | |
ChartStyle |The chart appearance settings’ storage. |
Note
Each chart element contain a style that configures the element appearance. For example, the Legend class provides the getStyle()/setStyle(LegendStyle) methods that manages the legend style.