BollingerBandsIndicator Class
A Bollinger Bands indicator.
Namespace: DevExpress.XamarinForms.Charts
Assembly: DevExpress.XamarinForms.Charts.dll
NuGet Package: DevExpress.XamarinForms.Charts
Declaration
public class BollingerBandsIndicator :
    CalculatedSeries
Remarks
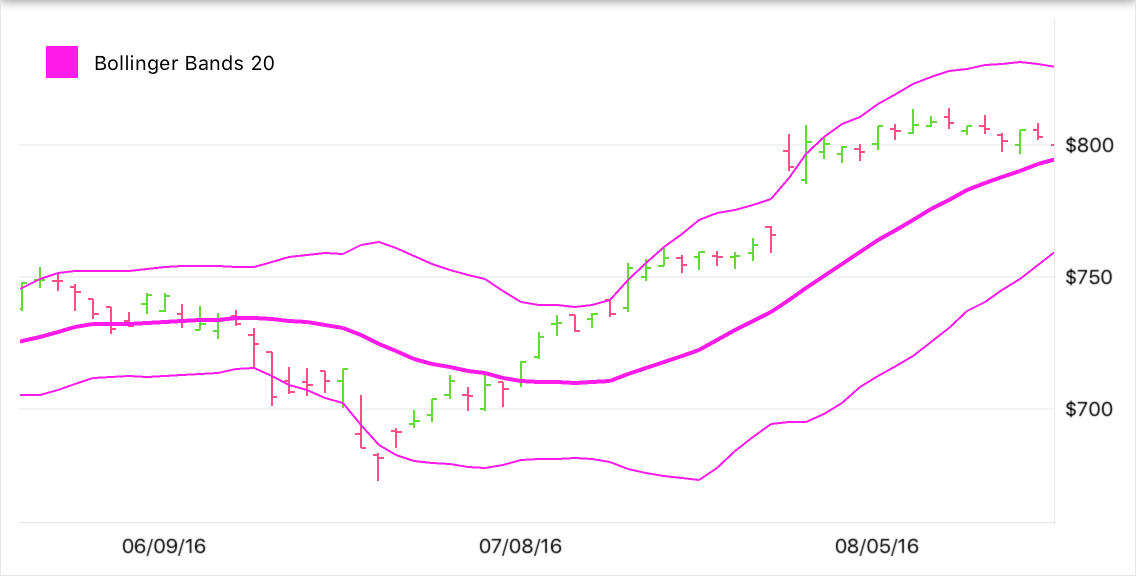
This indicator looks as follows:
ChartView also supports the StandardDeviationIndicator and MassIndexIndicator trend indicators for financial series.
Add an Indicator to a Series
This example demonstrates how to build a Bollinger Bands indicator for Close prices of a stock series.
- Add the
BollingerBandsIndicatorobject to the chart’s collection of series (ChartView.Series). - Set the indicator’s Data property to a CalculatedSeriesDataAdapter class instance. Use this object’s Series property to specify a series for which the indicator should be calculated.
- Use the ValueLevel and PointsCount properties to specify the price level of a financial series point and the number of data points used to calculate the simple moving average and standard deviation.
- Use the StandardDeviationMultiplier property to specify the number of standard deviations that define the distance between the moving average (middle band) and the upper/lower band.
<dxc:ChartView x:Name="chart">
    <dxc:ChartView.Series>
        <dxc:StockSeries>
            <dxc:StockSeries.Data>
                <dxc:SeriesDataAdapter DataSource="{Binding StockPrices}" ArgumentDataMember="Date">
                    <dxc:ValueDataMember Type="High" Member="High" />
                    <dxc:ValueDataMember Type="Low" Member="Low" />
                    <dxc:ValueDataMember Type="Open" Member="Open" />
                    <dxc:ValueDataMember Type="Close" Member="Close" />
                </dxc:SeriesDataAdapter>
            </dxc:StockSeries.Data>
        </dxc:StockSeries>

        <dxc:BollingerBandsIndicator ValueLevel="Close"
                                     PointsCount="20"
                                     StandardDeviationMultiplier="2"
                                     DisplayName="Bollinger Bands 20">
            <dxc:BollingerBandsIndicator.Data>
                <dxc:CalculatedSeriesDataAdapter Series="{Binding Series[0], Source={x:Reference chart}}"/>
            </dxc:BollingerBandsIndicator.Data>
        </dxc:BollingerBandsIndicator>
    </dxc:ChartView.Series>
</dxc:ChartView>
Customize Indicator Appearance
To change the line appearance of the Bollinger Bands indicator, set its Style property to the BollingerBandsIndicatorStyle object with the specified settings.
<dxc:BollingerBandsIndicator>
    <dxc:BollingerBandsIndicator.Style>
        <dxc:BollingerBandsIndicatorStyle Stroke="#ff1ceb" StrokeThickness="2"
                                          UpperStroke="#ff1ceb" LowerStroke="#ff1ceb" />
    </dxc:BollingerBandsIndicator.Style>

    <!--Indicator Data-->
</dxc:BollingerBandsIndicator>
Implements
Inheritance
Object
Xamarin.Forms.BindableObject
ChartElement
SeriesBase
Series
CalculatedSeries
BollingerBandsIndicator
See Also