DxChartZoomAndPanSettings Class
Configures zoom and pan settings.
Namespace: DevExpress.Blazor
Assembly: DevExpress.Blazor.v23.2.dll
NuGet Package: DevExpress.Blazor
Declaration
public class DxChartZoomAndPanSettings :
    DxComplexSettingsComponent<DxChartZoomAndPanSettings, ChartZoomAndPanSettingsModel>,
    IModelProvider<ChartZoomAndPanDragBoxStyleModel>
Remarks
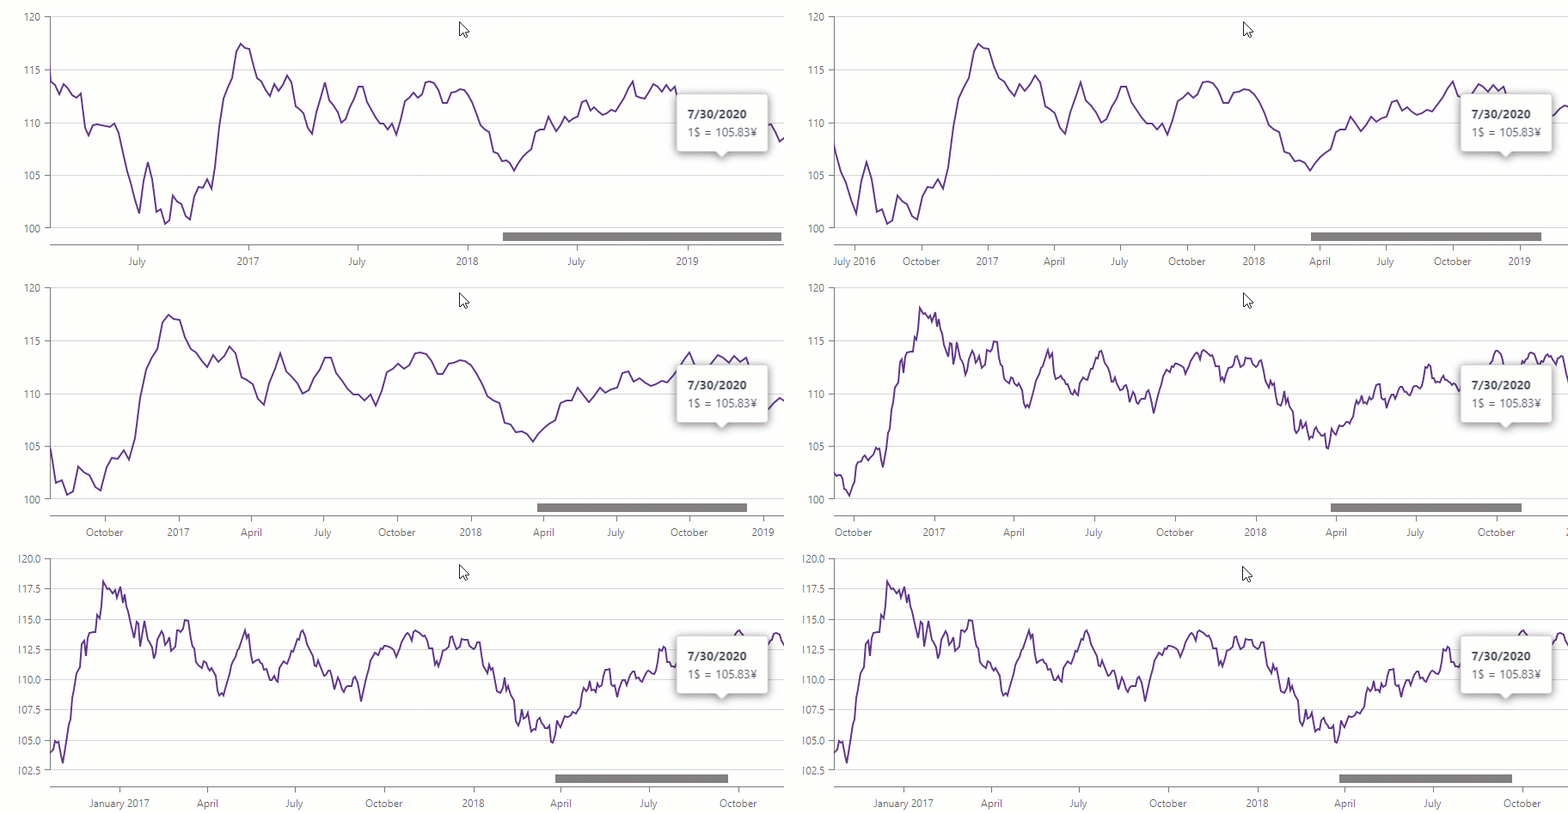
Users can zoom and pan the chart with the mouse wheel or touch gestures. To enable zoom/pan, add a DxChartZoomAndPanSettings object and specify its ArgumentAxisZoomAndPanMode and ValueAxisZoomAndPanMode properties. To disable the mouse wheel or touch gestures, use the AllowMouseWheel / AllowTouchGestures properties.
The DxChart component also allows users to select a specific chart area for zooming. To enable this functionality, set the AllowDragToZoom property to true. To pan the chart in this case, users should drag the mouse pressing the key specified by the PanKey property (the default key is Shift). To customize the drag box appearance, use a DxChartZoomAndPanDragBoxStyle object.
You can also add a scrollbar that allows users to pan the chart along the argument axis. To do this, add a DxChartScrollBarSettings object and set its ArgumentAxisScrollBarVisible property to true. Use the ArgumentAxisScrollBarPosition property to specify the scrollbar’s position.
<DxChart T="BargainDataPoint"
            Data="@UsdJpyData"
            @key="@Params.ThemeName"
            CssClass="w-100">
    <DxChartLegend Position="RelativePosition.Inside"
                    VerticalAlignment="VerticalEdge.Top"
                    HorizontalAlignment="HorizontalAlignment.Right" />
    <DxChartLineSeries T="BargainDataPoint"
                        TArgument="DateTime"
                        TValue="double"
                        ArgumentField="i => i.DateTimeStamp"
                        ValueField="i => i.Price"
                        Name="USDJPY">
        <DxChartSeriesPoint Visible="false" />
        <DxChartAggregationSettings Enabled="true"
                                    Method="ChartAggregationMethod.Average" />
    </DxChartLineSeries>
    <DxChartArgumentAxis>
        <DxChartAxisRange StartValue="new DateTime(2020, 01, 01)"
                            EndValue="new DateTime(2021, 01, 29)" />
    </DxChartArgumentAxis>
    <DxChartZoomAndPanSettings ArgumentAxisZoomAndPanMode="ChartAxisZoomAndPanMode.Both" />
    <DxChartScrollBarSettings ArgumentAxisScrollBarVisible="true"
                                ArgumentAxisScrollBarPosition="ChartScrollBarPosition.Bottom" />
    <DxChartTooltip Enabled="true" Position="RelativePosition.Outside">
        <div style="margin: 0.75rem">
            <div class="font-weight-bold">@(((DateTime)context.Point.Argument).ToString("d"))</div>
            <div>1$ = @(context.Point.Value)¥</div>
        </div>
    </DxChartTooltip>
</DxChart>

@code {
    IEnumerable<BargainDataPoint> UsdJpyData;
    @inject ICurrencyExchangeDataProvider UsdJpyDataProvider

    protected override async Task OnInitializedAsync() {
        UsdJpyData = await UsdJpyDataProvider.GetDataAsync();
    }
}
