DxChartAxis<T>.VisualRangeUpdateMode Property
Specifies how the axis visual range should behave if new points are added to the data source.
Namespace: DevExpress.Blazor
Assembly: DevExpress.Blazor.v24.1.dll
Declaration
[DefaultValue(ChartVisualRangeUpdateMode.Auto)]
[Parameter]
public ChartVisualRangeUpdateMode VisualRangeUpdateMode { get; set; }
Property Value
| Type | Default | Description |
|---|---|---|
| ChartVisualRangeUpdateMode | Auto | An enumeration value. |
Available values:
| Name | Description |
|---|---|
| Shift | The visual range moves to the axis end and keeps its length. Applies to argument axes only. |
| Reset | The visual range matches the data range. |
| Keep | The visual range does not change. |
| Auto |
|
Remarks
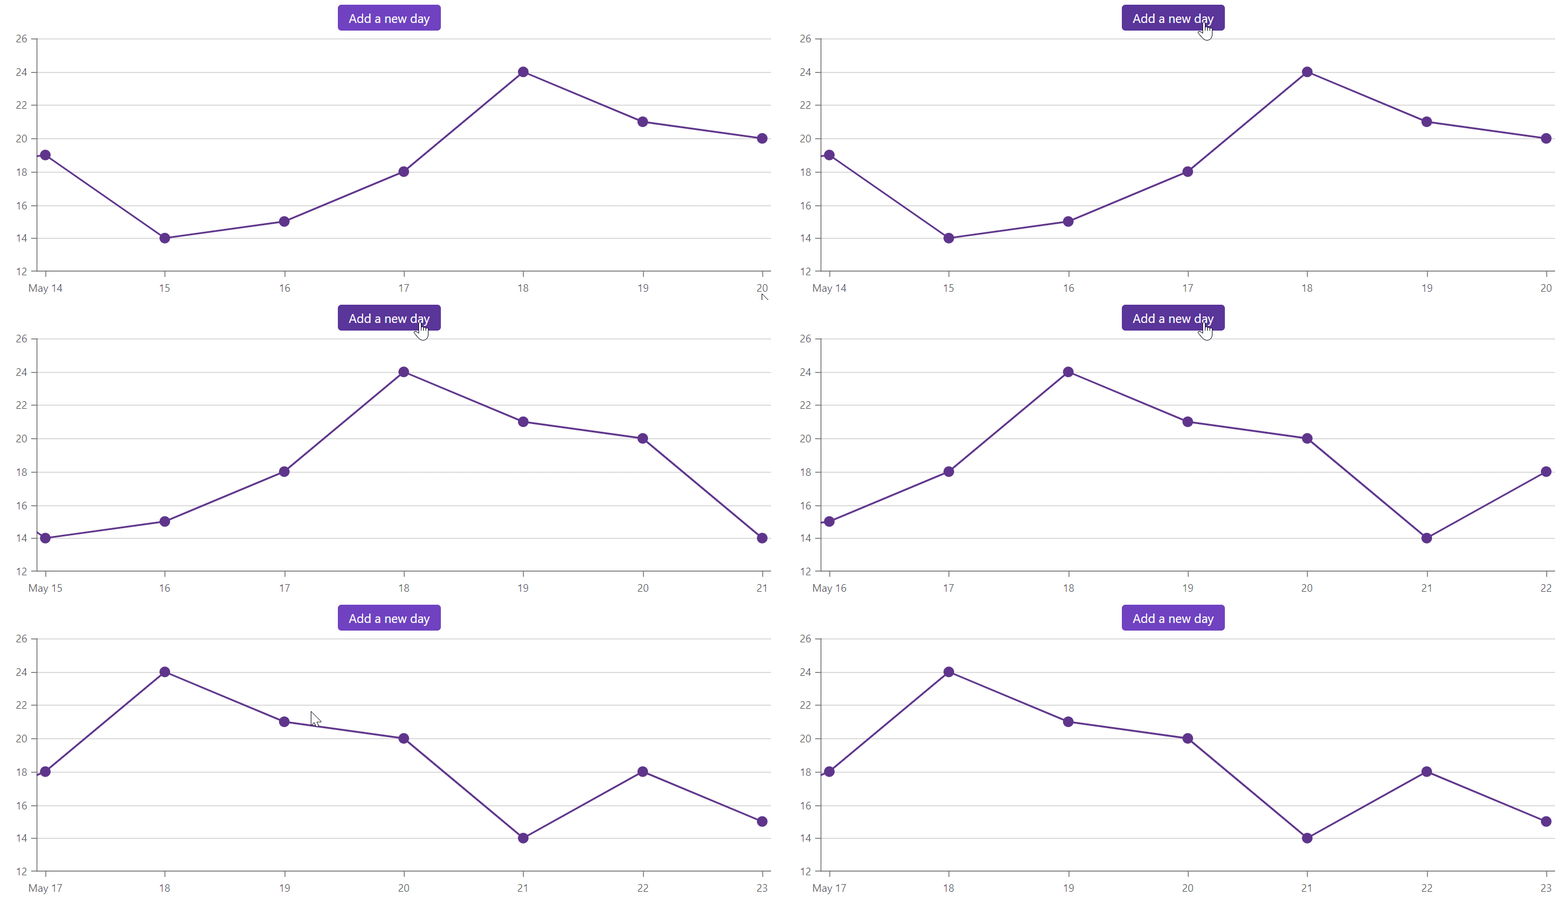
Use the VisualRangeUpdateMode property to specify how the visual range should behave if new points are added to the data source.
The code sample below sets the visual range of the argument axis and shifts the range when a new data item is added:
<DxButton Text="Add a new day"
          Click="(e) => GenerateNewItem()">
</DxButton>

<DxChart Data="@DataList" @ref="Chart">
    <DxChartLineSeries T="DailyData"
                       TArgument="DateTime"
                       TValue="int"
                       ArgumentField="@(s => s.Date)"
                       ValueField="@(s => s.Value)" />
    <DxChartArgumentAxis VisualRangeUpdateMode="ChartVisualRangeUpdateMode.Shift">
          <DxChartAxisRange StartValue="new DateTime(2020, 05, 14)"
                            EndValue="new DateTime(2020, 05, 20)" />
    </DxChartArgumentAxis>
    <DxChartLegend Visible="false" />
</DxChart>

@code {
    int DaysNum { get; set; } = 0;
    DxChart<DailyData> Chart;
    static readonly Random random = new Random();

    protected override void OnInitialized() {
        DataList = GetData();
    }

    void GenerateNewItem() {
        DataList.Add(new DailyData() {
            Date = new DateTime(2020, 05, 20).AddDays(++DaysNum),
            Value = random.Next(10, 20)
        });
        Chart.RefreshData();
    }
}

See Also