DxChartAnnotationBase<T> Class
Defines the base API for classes that implement chart annotations.
Namespace: DevExpress.Blazor
Assembly: DevExpress.Blazor.v24.1.dll
Declaration
public class DxChartAnnotationBase<T> :
    DxComplexSettingsComponent<DxChartAnnotationBase<T>, T>,
    IModelProvider<ChartFontModel>,
    IModelProvider<ChartAnnotationBorderModel>,
    IModelProvider<ChartAnnotationShadowModel>,
    IModelProvider<ChartAnnotationImageModel>
    where T : ChartAnnotationBaseModel<T>
Type Parameters
| Name | Description |
|---|---|
| T | The data type. |
Remarks
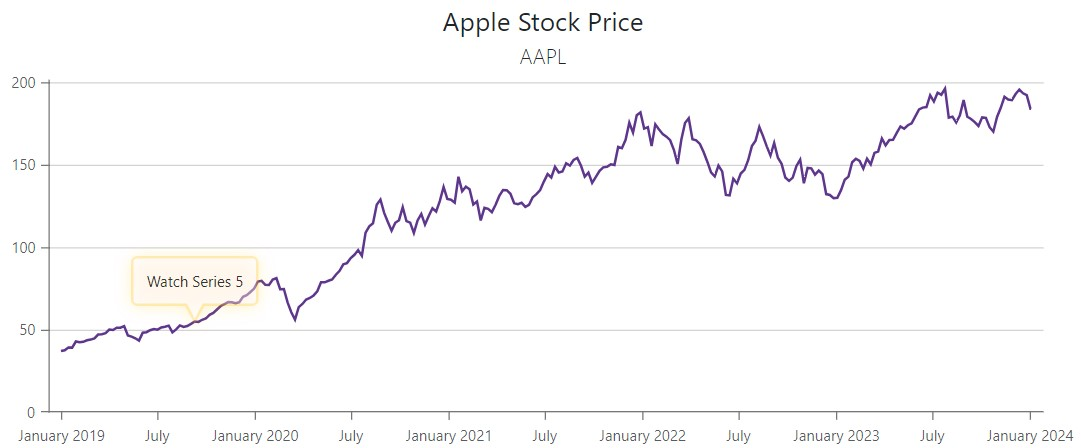
Annotations are comments that contain information about chart content. Chart components support text and image annotations. You can anchor annotations to chart elements (series points or axes) or position annotations based on pixel coordinates.
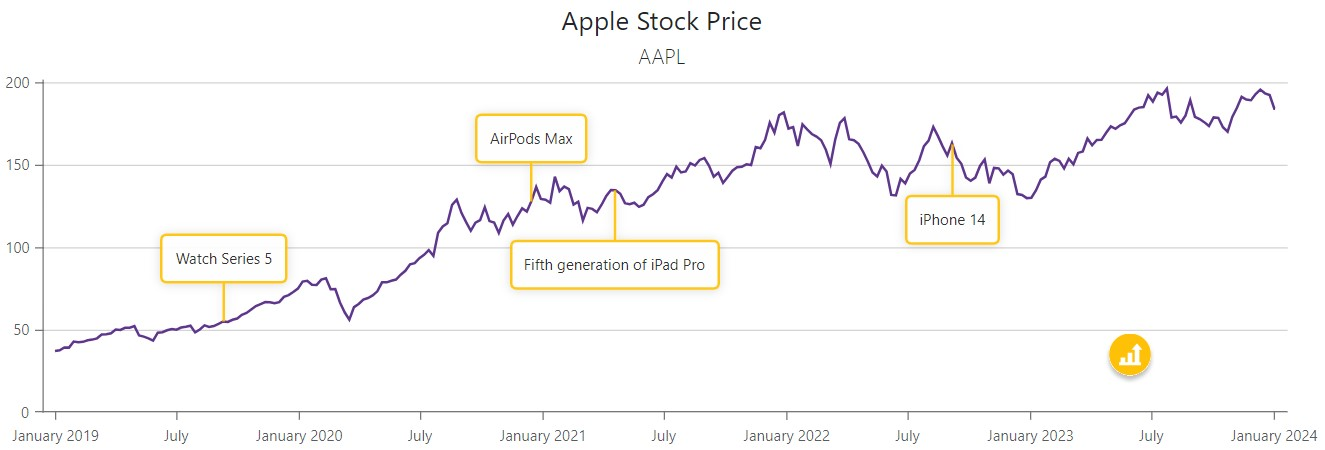
To create an annotation, follow the steps below:
Add an appropriate annotation object to chart markup (DxChartAnnotation for DxChart, DxPieChartAnnotation for DxPieChart).
Specify the annotation type and location.
Optional. Customize the annotation size and appearance, and configure tooltips.
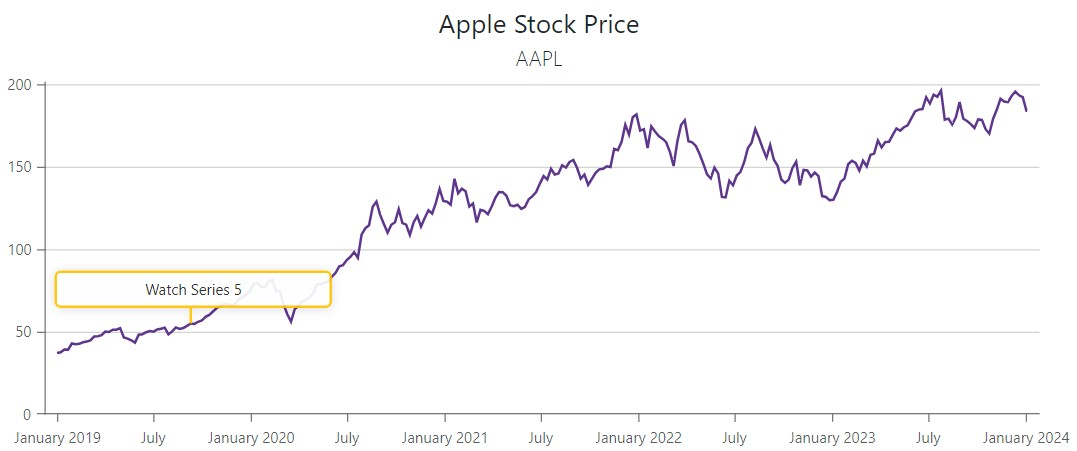
<DxChart Data="@DataSource"
         Width="100%">
    <DxChartTitle Text="Apple Stock Price">
        <DxChartSubTitle Text="AAPL"></DxChartSubTitle>
    </DxChartTitle>
    <DxChartLegend Visible="false" />
    <DxChartArgumentAxis ArgumentType="ChartAxisDataType.DateTime" />
    <DxChartLineSeries ValueField="@((ApplePrice i) => i.Close)"
                       ArgumentField="@((ApplePrice i) => i.Date)"
                       Name="AAPL" />
    @foreach(var annotation in AnnotationSource) {
        <DxChartAnnotation Argument="@annotation.Argument"
                           Series="@annotation.Series"
                           Text="@annotation.Text"
                           VerticalOffset="@annotation.VerticalOffset"
                           TooltipText="@annotation.TooltipText"
                           ArrowWidth="0">
            <DxChartAnnotationBorder Color="#FFC107" Width="2" CornerRadius="4" />
        </DxChartAnnotation>
    }
    <DxChartAnnotation PositionX="900"
                       PositionY="230"
                       Type="ChartAnnotationType.Image"
                       TooltipText="Drag me"
                       Color="transparent"
                       AllowDrag="true"
                       PaddingLeftRight="0"
                       PaddingTopBottom="0">
        <DxChartAnnotationImage Url="@StaticAssetUtils.GetImagePath("AppleStock/stock.svg")"
                                Width="40"
                                Height="40" />
        <DxChartAnnotationBorder Visible="false" />
    </DxChartAnnotation>
</DxChart>

@code {
    IEnumerable<ApplePrice> DataSource = Enumerable.Empty<ApplePrice>();
    protected override void OnInitialized() {
        DataSource = ChartApplePriceDataProvider.GenerateData();
    }
    public class Annotation {
        public DateTime Argument { get; set; }
        public string Series { get; set; }
        public int VerticalOffset { get; set; }
        public string Text { get; set; }
        public string TooltipText { get; set; }
    }
    List<Annotation> AnnotationSource = new List<Annotation>() {
        new Annotation {
            Argument = new DateTime(2019, 9, 10),
            Series = "AAPL",
            Text = "Watch Series 5",
            VerticalOffset = -50,
            TooltipText = @"Apple Watch Series 5 was announced
                          on September 10, 2019."
        },
        new Annotation {
        Argument = new DateTime(2020, 12, 15),
            Series = "AAPL",
            Text = "AirPods Max",
            VerticalOffset = -50,
            TooltipText = @"AirPods Max — wireless Bluetooth over-ear
                          headphones — were released on December 15, 2020."
        },
        new Annotation {
            Argument = new DateTime(2021, 4, 20),
            Series = "AAPL",
            VerticalOffset = 60,
            Text = "Fifth generation of iPad Pro",
            TooltipText = @"The fifth generation of iPad Pro was announced
                          on April, 2021."
        },
        new Annotation {
            Argument = new DateTime(2022, 9, 7),
            Series = "AAPL",
            Text = "iPhone 14",
            VerticalOffset = 60,
            TooltipText = @"iPhone 14 and iPhone 14 Plus — sixteenth-generation
                          iPhones — were announced on September 7, 2022."
       }
    };
}
Type
Use the Type property to specify whether the chart displays image or text content within the corresponding annotation.
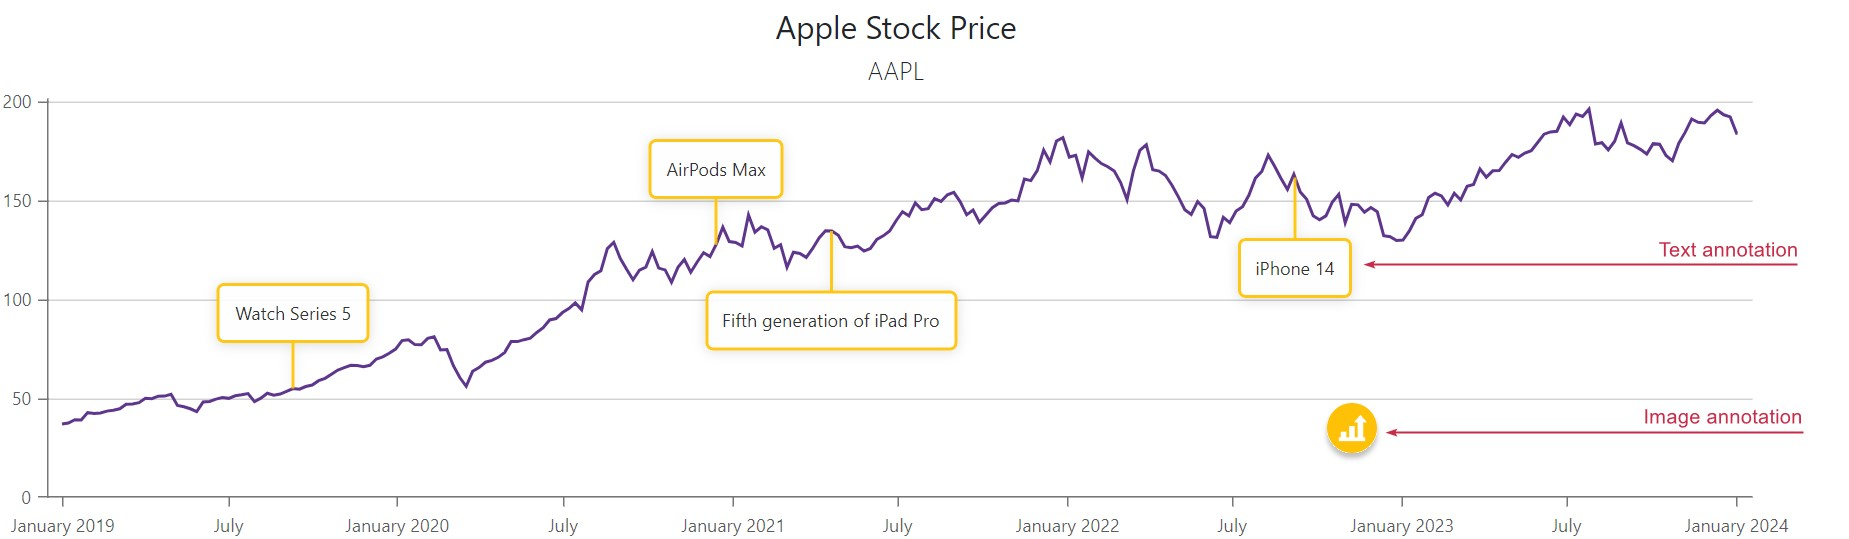
The default annotation type is Text. To display text content, assign a text string to the Text property. You can also use the TextOverflow or WordWrap property to define how the chart displays the specified text.
<DxChartAnnotation Type="ChartAnnotationType.Text"
                   Text="iPhone 14"
                   TextOverflow="ChartTextOverflow.None">
    @* ... *@
</DxChartAnnotation>
To create an image annotation, follow the steps below:
- Set the Type property to
Image. - Add a DxChartAnnotationImage object to the markup.
- Specify an image’s URL (the Url property) and size (Height and Width properties).
<DxChartAnnotation Type="ChartAnnotationType.Image">
    <DxChartAnnotationImage Url="@StaticAssetUtils.GetImagePath("AppleStock/stock.svg")"
                            Width="40"
                            Height="40" />
    @* ... *@
</DxChartAnnotation>
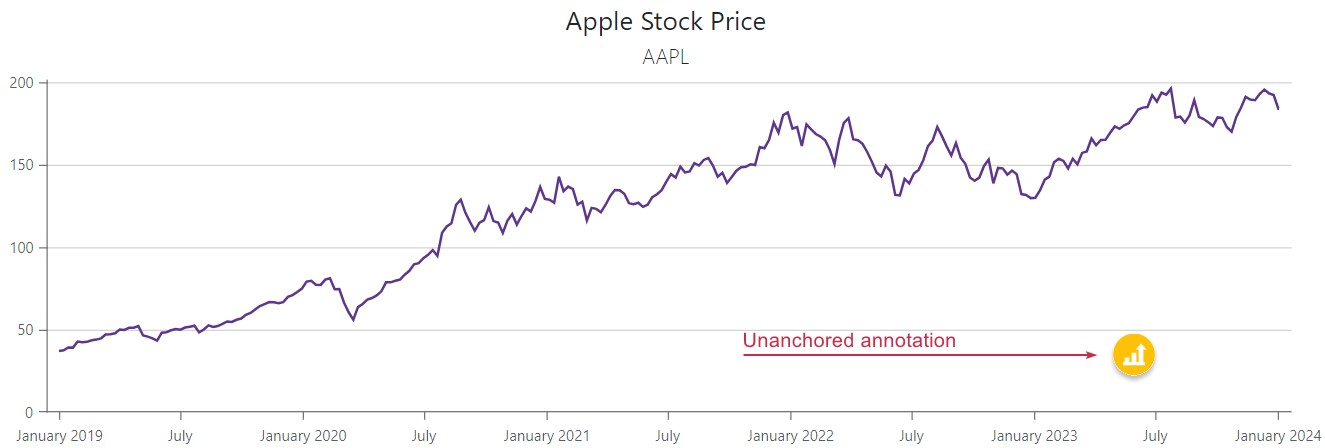
Location
The Chart component allows you to specify the annotation location. You can anchor the annotation to a chart element or use X and Y coordinates to create an unanchored annotation.
The Chart component also allows users to drag annotations. To enable this functionality, set the AllowDrag property to true.
Unanchored Annotations
Specify the annotation’s PositionX and PositionY properties to position the annotation relative to the top left corner of the chart container. Such annotation is unanchored – it does not point to any chart element.
<DxChartAnnotation PositionX="900"
                   PositionY="230"
                   Type="ChartAnnotationType.Image">
    <DxChartAnnotationImage Url="@StaticAssetUtils.GetImagePath("AppleStock/stock.svg")"
                            Width="40"
                            Height="40" />
</DxChartAnnotation>
Anchored Annotations
Anchored annotations point to chart elements (series points, argument or value axes). To anchor the annotation, use one of the following approaches:
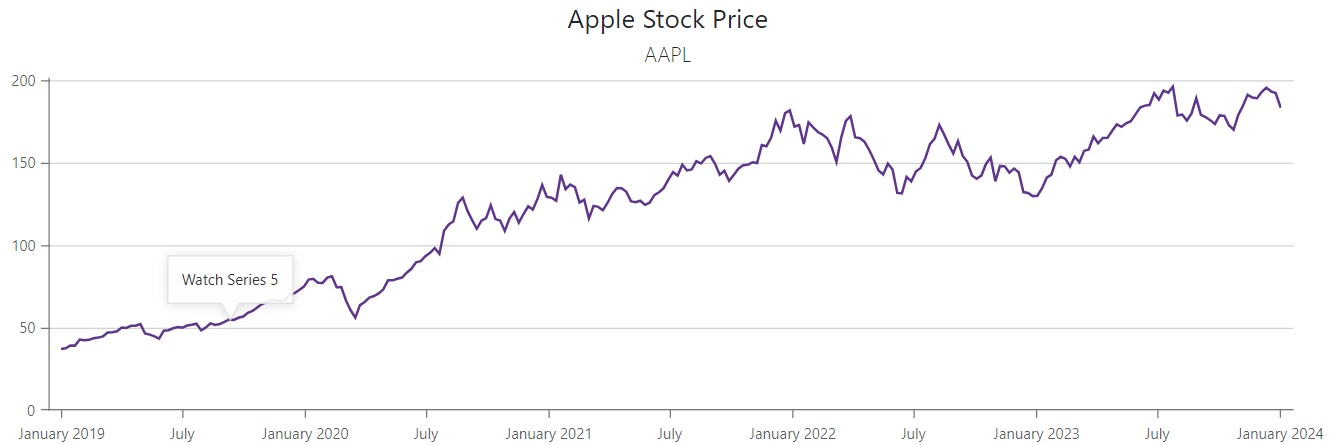
Anchor the Annotation to a Series Point
Use the annotation’s Series and Argument properties to dock the annotation to a particular series point.
<DxChart Data="@DataSource">
    <DxChartLineSeries ValueField="@((ApplePrice i) => i.Close)"
                       ArgumentField="@((ApplePrice i) => i.Date)"
                       Name="AAPL" />
    <DxChartAnnotation Argument="new DateTime(2019, 9, 10)"
                       Series="AAPL"
                       Text="Watch Series 5">
    </DxChartAnnotation>
</DxChart>
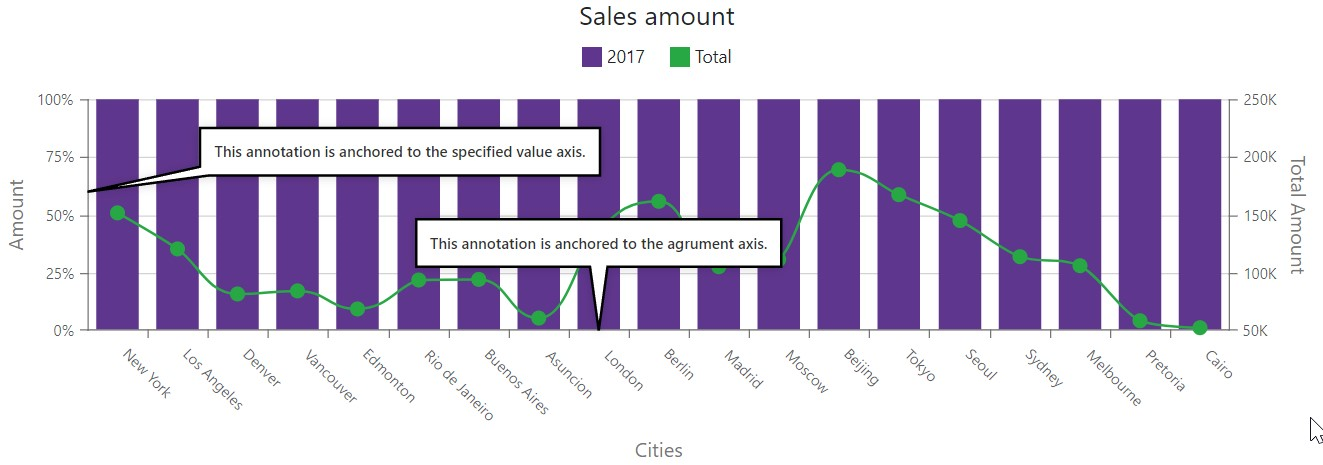
Display the Annotation on an Axis
Specify the annotation’s DxChartAnnotationBase.Argument or DxChartAnnotation.Value property to anchor the annotation to the argument or value axis. If your DxChart component contains multiple axes, specify the DxChartAnnotation.Axis property.
<DxChart Data="SalesData">
    @* ... *@
    <DxChartArgumentAxis>
        <DxChartAxisTitle Text="Cities" />
    </DxChartArgumentAxis>
    <DxChartValueAxis Name="Amount">
        @* ... *@
        <DxChartAxisTitle Text="Amount" />
    </DxChartValueAxis>
    <DxChartValueAxis Name="TotalAxis" Alignment="ChartAxisAlignment.Far">
        <DxChartAxisTitle Text="Total Amount" />
    </DxChartValueAxis>
    <DxChartAnnotation Value="0.6"
                        Axis="Amount"
                        Text="This annotation is anchored to the specified value axis."
                        Opacity="1"
                        HorizontalOffset="250">
        @* ... *@
    </DxChartAnnotation>
    <DxChartAnnotation Argument="@("London")"
                        Text="This annotation is anchored to the agrument axis."
                        Opacity="1"
                        VerticalOffset="-70">
        @* ... *@
    </DxChartAnnotation>
    @* ... *@
</DxChart>
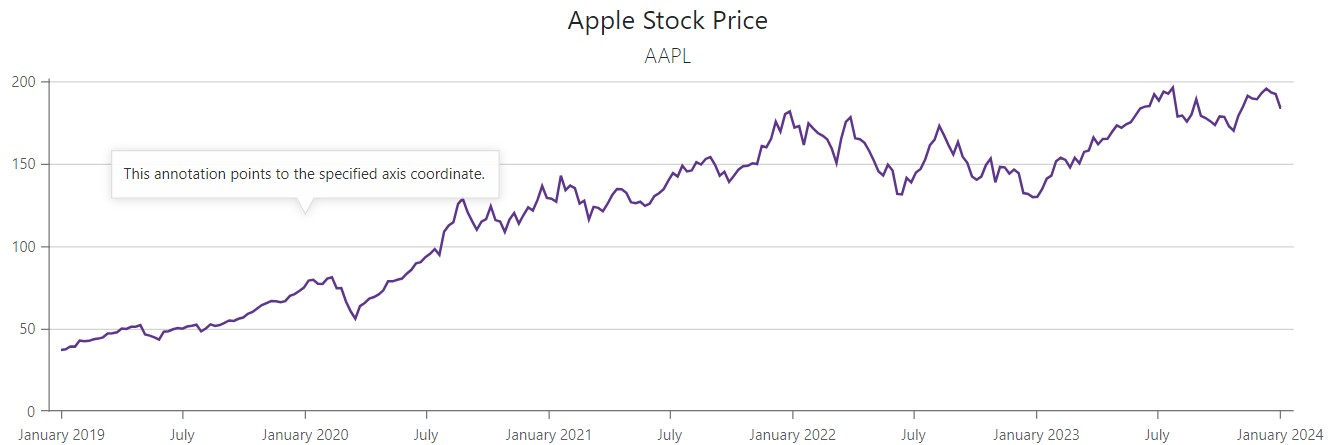
Anchor the Annotation to a Chart Coordinate
Specify both Argument and Value properties to anchor the annotation to the specified chart coordinate.
<DxChart Data="@DataSource">
    <DxChartLineSeries ValueField="@((ApplePrice i) => i.Close)"
                       ArgumentField="@((ApplePrice i) => i.Date)"
                       Name="AAPL" />
    <DxChartAnnotation Value="120"
                       Argument="new DateTime(2020, 1, 1)"
                       Text="This annotation points to the specified axis coordinate.">
    </DxChartAnnotation>
</DxChart>
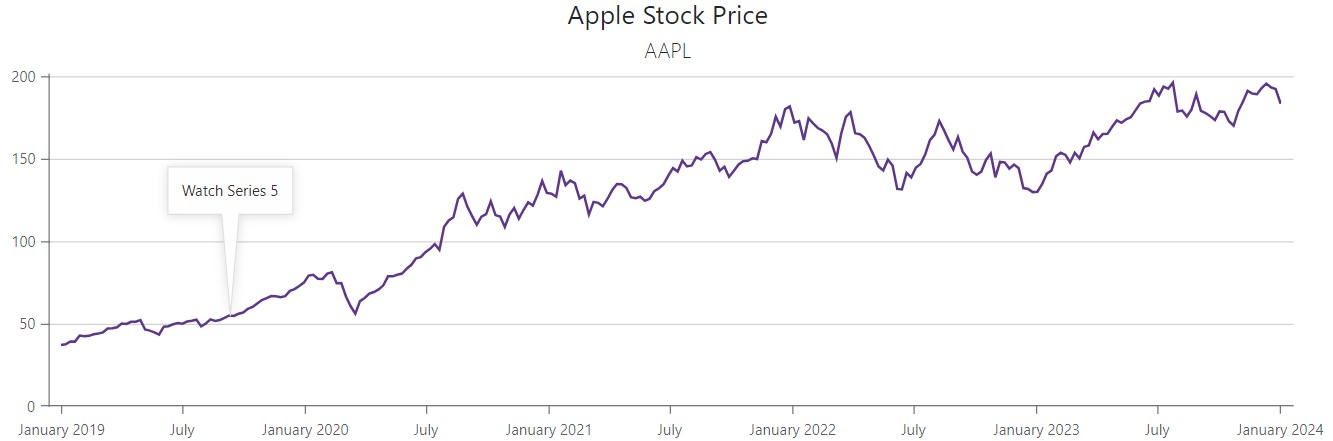
Mixed Anchoring
You can use pixel and chart coordinates simultaneously to place the anchored annotation to the specified position.
<DxChart Data="@DataSource">
    <DxChartLineSeries ValueField="@((ApplePrice i) => i.Close)"
                        ArgumentField="@((ApplePrice i) => i.Date)"
                        Name="AAPL" />
    <DxChartAnnotation Argument="new DateTime(2019, 9, 10)"
                        Series="AAPL"
                        PositionX="175"
                        PositionY="100"
                        Text="Watch Series 5">
    </DxChartAnnotation>
</DxChart>
DxPieChart Specifics
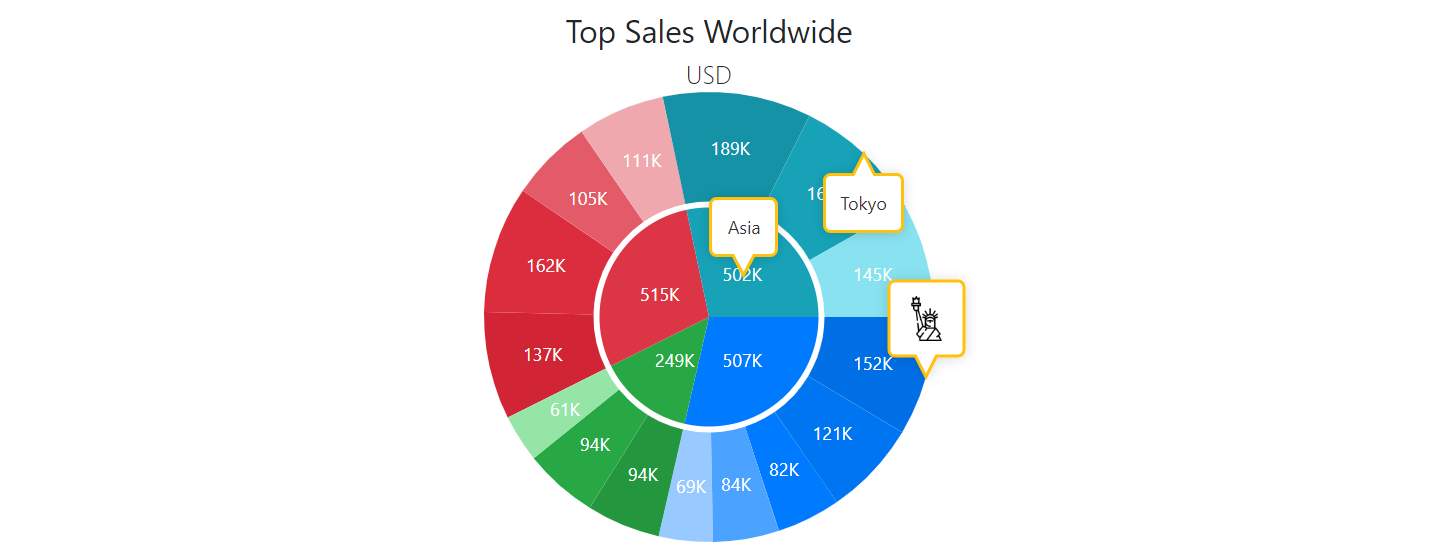
In DxPieChart, you can also create anchored and unanchored annotations. Anchored annotations in DxPieChart point to series points specified by the Argument property. If your DxPieChart component contains multiple series, use the Series property.
Additionaly, you can specify the Location property to position the annotation at the edge or in the center of the specified argument.
<DxPieChart Data="@SalesData">
    <DxPieChartAnnotation Text="Asia"
                          Argument="@("Asia")"
                          Series="Region Sales"
                          Opacity="1">
        <DxChartAnnotationBorder Color="#FFC107" Width="2" CornerRadius="4" />
    </DxPieChartAnnotation>
    <DxPieChartAnnotation Text="Tokyo"
                          Argument="@("Tokyo")"
                          Series="City Sales"
                          Location="PieChartAnnotationLocation.Edge"
                          Opacity="1">
         <DxChartAnnotationBorder Color="#FFC107" Width="2" CornerRadius="4" />
     </DxPieChartAnnotation>
     <DxPieChartAnnotation Type="ChartAnnotationType.Image"
                           Argument="@("New York")"
                           Series="City Sales"
                           Location="PieChartAnnotationLocation.Edge"
                           Opacity="1">
         <DxChartAnnotationImage Url="https://cdn-icons-png.flaticon.com/512/618/618848.png" />
         <DxChartAnnotationBorder Color="#FFC107" Width="2" CornerRadius="4" />
     </DxPieChartAnnotation>
    @* ... *@
    <DxChartTitle Text="Top Sales Worldwide">
        <DxChartSubTitle Text="USD" />
    </DxChartTitle>
</DxPieChart>
Size
Use Height and Width properties to specify the annotation size. ArrowLength and ArrowWidth properties allow you to customize the size of the annotation arrow.
You can also use PaddingLeftRight and PaddingTopBottom properties to add or remove empty space around annotation content.
<DxChartAnnotation Argument="new DateTime(2019, 9, 10)"
                   Series="AAPL"
                   Text="Watch Series 5"
                   Width="200"
                   PaddingTopBottom="5"
                   ArrowWidth="0">
    @* ... *@
</DxChartAnnotation>
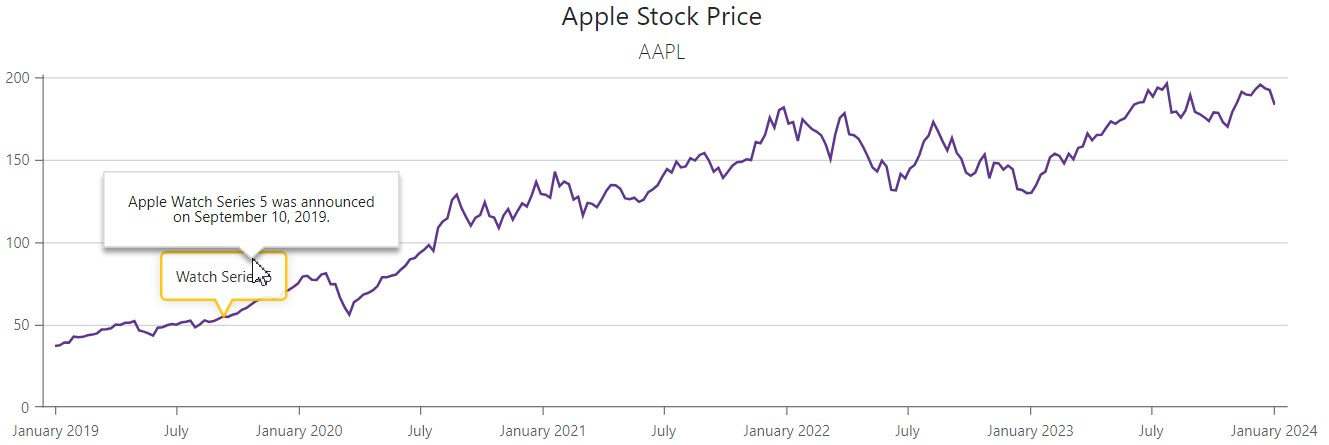
Tooltips
The Chart component displays tooltips when a user hovers a mouse pointer over chart annotations. Use the TooltipText property to specify tooltip text content. To disable tooltip functionality for an annotation, set the TooltipEnabled property to false.
<DxChartAnnotation Argument="new DateTime(2019, 9, 10)"
                   Series="AAPL"
                   Text="Watch Series 5"
                   TooltipText = "Apple Watch Series 5 was announced
                                  on September 10, 2019.">
    @* ... *@
</DxChartAnnotation>
Appearance Customization
The Chart component allows you to customize annotation appearance. The following options are available:
- Change color (the Color property).
- Specify transparency (the Opacity property).
- Configure borders (the DxChartAnnotationBorder component).
- Configure shadows (the DxChartAnnotationShadow component).
- Configure font settings (the DxChartFont component).
<DxChartAnnotation Argument="new DateTime(2019, 9, 10)"
                   Series="AAPL"
                   Text="Watch Series 5"
                   Opacity="0.3">
    <DxChartAnnotationBorder Color="#FFC107" Width="2" CornerRadius="4" Opacity="0.8"/>
    <DxChartAnnotationShadow Color="#FFC107" Blur="6" Opacity="0.7"/>
</DxChartAnnotation>