DxChartAnnotation.Value Property
Specifies a data point’s value to anchor the annotation.
Namespace: DevExpress.Blazor
Assembly: DevExpress.Blazor.v24.1.dll
Declaration
[Parameter]
public object Value { get; set; }
Property Value
| Type | Description |
|---|---|
| Object | The data point’s value. |
Remarks
Specify the Value property to display the annotation on the value axis. If your DxChart component contains multiple value axes, use the Axis property to display the annotation on a particular value axis.
<DxChart Data="SalesData">
    @* ... *@
    <DxChartValueAxis Name="Amount">
        @* ... *@
        <DxChartAxisTitle Text="Amount" />
    </DxChartValueAxis>
    <DxChartValueAxis Name="TotalAxis" Alignment="ChartAxisAlignment.Far">
        <DxChartAxisTitle Text="Total Amount" />
    </DxChartValueAxis>
    <DxChartAnnotation Value="0.6"
                       Axis="Amount"
                       Text="This annotation is anchored to the specified value axis."
                       Opacity="1"
                       HorizontalOffset="250">
        @* ... *@
    </DxChartAnnotation>
    <DxChartFullStackedBarSeries Name="2017"
                                 Filter="@((SaleInfo s) => s.Date.Year == 2017)"
                                 SummaryMethod="Enumerable.Sum"
                                 ArgumentField="@(s => s.City)"
                                 ValueField="@(s => s.Amount)" />
    <DxChartSplineSeries Name="Total"
                         SummaryMethod="Enumerable.Sum"
                         ArgumentField="@((SaleInfo s) => s.City)"
                         ValueField="@(s => s.Amount)"
                         Axis="TotalAxis" />
</DxChart>

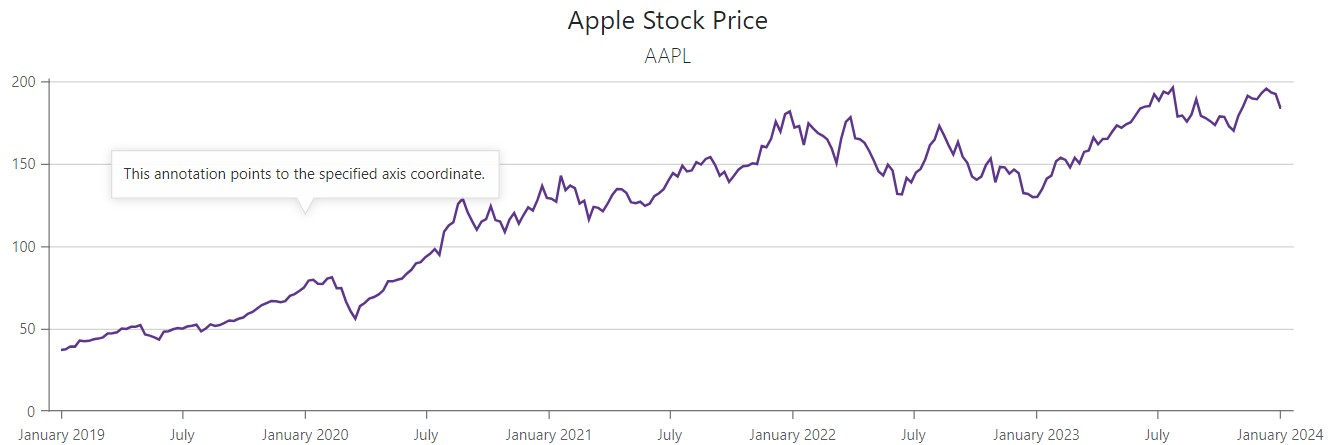
You can also specify Value and Argument properties simultaneously to anchor the annotaton to a chart coordinate.
<DxChart Data="@DataSource">
    <DxChartLineSeries ValueField="@((ApplePrice i) => i.Close)"
                       ArgumentField="@((ApplePrice i) => i.Date)"
                       Name="AAPL" />
    <DxChartAnnotation Value="120"
                       Argument="new DateTime(2020, 1, 1)"
                       Text="This annotation points to the specified axis coordinate.">
    </DxChartAnnotation>
</DxChart>
See Also