Charts for .NET MAUI. Data Adapters
- 4 minutes to read
Series may contain different data: arguments, values, dates, labels, and so on. The set of data depends on the chart type. For example, a pie chart requires a series that contain labels and values only, while a candlestick chart requires dates and the open, close, high, and low values. DevExpress Charts for .NET MAUI use data adapters to consume series data. This topic explains how to use the predefined data adapters and create custom ones.
Pie Chart Data Adapter
The PieSeriesDataAdapter is a data adapter that you can use in the PieChartView component. The data adapter exposes the following properties:
- DataSource—specifies the data source. You can use a IBindingList, INotifyCollectionChanged, IList, and IList<T> objects.
- ValueDataMember—specifies the data field that contains values of pie slices.
- LabelDataMember—specifies the data field that contains labels for pie slices.
<dxc:PieChartView>
    <dxc:PieChartView.BindingContext>
        <local:ViewModel/>
    </dxc:PieChartView.BindingContext>
    <dxc:PieChartView.Series>
        <dxc:PieSeries>
            <dxc:PieSeries.Data>
                <dxc:PieSeriesDataAdapter DataSource="{Binding LandAreas}"
                                          LabelDataMember="CountryName"
                                          ValueDataMember="Area"/>
            </dxc:PieSeries.Data>
        </dxc:PieSeries>
    </dxc:PieChartView.Series>
</dxc:PieChartView>
Cartesian Chart Data Adapter
The SeriesDataAdapter is a data adapter that you can use in the ChartView component. The data adapter exposes the following properties:
- DataSource—gets or sets the data source. You can use a IBindingList, INotifyCollectionChanged, IList, and IList<T> objects.
- ArgumentDataMember—gets or sets the data field that contains point arguments.
- ValueDataMembers—gets or sets a collection of ValueDataMember objects that specify point values. Each object specifies the data field that contains point values and the value type.
Most series contain a single value for each argument. For those series, it is sufficient to add one ValueDataMember object to the ValueDataMembers collection and set its Type property to Value.
<dxc:ChartView>
  <dxc:ChartView.Series>
    <dxc:LineSeries>
      <dxc:LineSeries.Data>
        <dxc:SeriesDataAdapter DataSource="{Binding GdpValues}" ArgumentDataMember="Year">
          <dxc:SeriesDataAdapter.ValueDataMembers>
            <dxc:ValueDataMember Type="Value" Member="Value"/>
          </dxc:SeriesDataAdapter.ValueDataMembers>
        </dxc:SeriesDataAdapter>
      </dxc:LineSeries.Data>
    </dxc:LineSeries>
  </dxc:ChartView.Series>
</dxc:ChartView>
Tip
ValueDataMembers is a content property. You can omit property tags in the markup.
For a CandleStickSeries and StockSeries, add four ValueDataMember objects to the collection and set their Type properties to High, Low, Open, and Close.
<dxc:ChartView>
  <dxc:ChartView.Series>
    <dxc:CandleStickSeries>
      <dxc:CandleStickSeries.Data>
        <dxc:SeriesDataAdapter DataSource="{Binding StockPrices}" ArgumentDataMember="Date">
            <dxc:ValueDataMember Type="High" Member="HighValue" />
            <dxc:ValueDataMember Type="Low" Member="LowValue" />
            <dxc:ValueDataMember Type="Open" Member="OpenValue" />
            <dxc:ValueDataMember Type="Close" Member="CloseValue" />
        </dxc:SeriesDataAdapter>
      </dxc:CandleStickSeries.Data>
    </dxc:CandleStickSeries>
  </dxc:ChartView.Series>
</dxc:ChartView>
For a RangeBarSeries, add two ValueDataMember objects to the collection and set their Type properties to High and Low.
<dxc:ChartView>
    <dxc:ChartView.Series>
        <dxc:RangeBarSeries>
            <dxc:RangeBarSeries.Data>
                <dxc:SeriesDataAdapter DataSource="{Binding OilPrices}" ArgumentDataMember="Month">
                    <dxc:ValueDataMember Type="High" Member="HighValue" />
                    <dxc:ValueDataMember Type="Low" Member="LowValue" />
                </dxc:SeriesDataAdapter>
            </dxc:RangeBarSeries.Data>
        </dxc:RangeBarSeries>
    </dxc:ChartView.Series>
</dxc:ChartView>
For BubbleSeries, add two ValueDataMember objects to the collection and set their Type property to Value and Weight.
<dxc:ChartView>
  <dxc:ChartView.Series>
    <dxc:BubbleSeries>
      <dxc:BubbleSeries.Data>
        <dxc:SeriesDataAdapter DataSource="{Binding HighestGrossingFilms}" ArgumentDataMember="Date">
            <dxc:ValueDataMember Type="Value" Member="Value" />
            <dxc:ValueDataMember Type="Weight" Member="WorldwideGrosses" />
        </dxc:SeriesDataAdapter>
      </dxc:BubbleSeries.Data>
    </dxc:BubbleSeries>
  </dxc:ChartView.Series>
</dxc:ChartView>
Custom Data Adapters
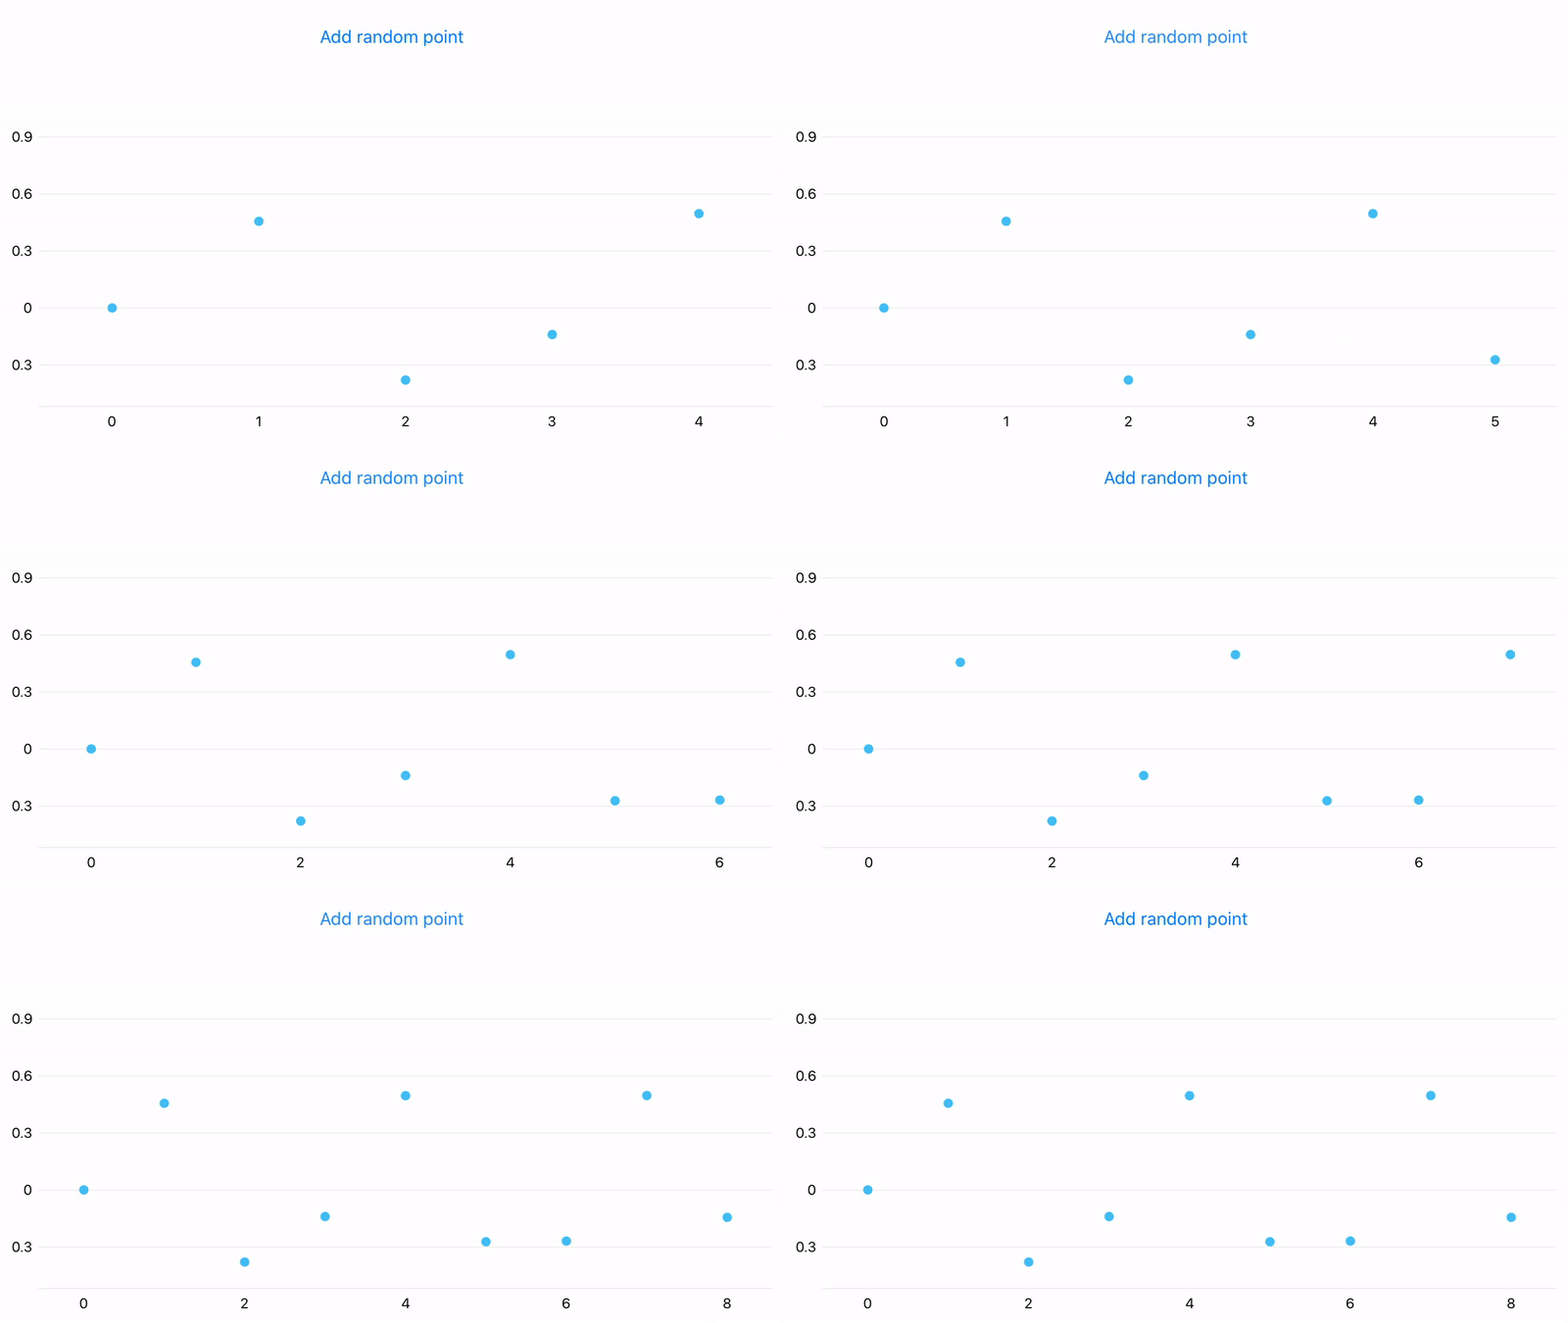
The example below shows how to populate a chart with random data points generated when a user clicks a button.

The example uses a custom data adapter because there is no need to store data. To create a custom adapter, implement the following interfaces in the code-behind MainPage.xaml.cs file:
- IXYSeriesData—to store data values.
- IChangeableSeriesData—to refresh the chart series data (in the current example, it adds new data points to the chart).
using System;
using System.Collections.Generic;
using Microsoft.Maui.Forms;
using DevExpress.Maui.Charts;

namespace TestApp {
    public class CustomDataAdapter : BindableObject, IXYSeriesData, IChangeableSeriesData {
        const int MaxDataCount = 30;
        int dataCount = 0;
        int offset = 0;

        public event DataChangedEventHandler DataChanged;

        public void Next() {
            dataCount++;
            DataChanged?.Invoke(this, DataChangedEventArgs.Add());
            if (dataCount > MaxDataCount) {
                offset++;
                dataCount = MaxDataCount;
                DataChanged?.Invoke(this, DataChangedEventArgs.Remove(0));
            }
        }

        int IXYSeriesData.GetDataCount() => dataCount;
        SeriesDataType IXYSeriesData.GetDataType() => SeriesDataType.Numeric;
        object IXYSeriesData.GetKey(int index) => index;
        double IXYSeriesData.GetNumericArgument(int index) => offset + index;
        DateTime IXYSeriesData.GetDateTimeArgument(int index) => throw new NotImplementedException();
        string IXYSeriesData.GetQualitativeArgument(int index) => throw new NotImplementedException();

        double IXYSeriesData.GetValue(DevExpress.Maui.Charts.ValueType valueType, int index) {
            switch (valueType) {
                case DevExpress.Maui.Charts.ValueType.Value:
                    double argument = index + offset;
                    return Math.Sin(argument) * Math.Cos(argument);
            }
            return 0.0;
        }
    }
}
In the MainPage.xaml file, do the following to associate the adapter with the chart:
- Create a new PointSeries object.
- Set its Data property to the custom adapter.
- Add it to the ChartView.Series collection.
<ContentPage
    xmlns="http://schemas.microsoft.com/dotnet/2021/maui"
    xmlns:x="http://schemas.microsoft.com/winfx/2009/xaml"
    xmlns:dxc="clr-namespace:DevExpress.Maui.Charts;assembly=DevExpress.Maui.Charts"
    xmlns:local="clr-namespace:TestApp"
    x:Class="TestApp.MainPage">

    <dxc:ChartView x:Name="chart">
        <dxc:ChartView.Series>
            <dxc:PointSeries>
                <dxc:PointSeries.Data>
                    <local:CustomDataAdapter/>
                </dxc:PointSeries.Data>
            </dxc:PointSeries>
        </dxc:ChartView.Series>
    </dxc:ChartView>
</ContentPage>
Add a button that refreshes chart data.
<Button HorizontalOptions="FillAndExpand" Clicked="Button_Click" Text="Add random point"/>
using System;
using System.Collections.Generic;
using Microsoft.Maui.Controls;
using DevExpress.Maui.Charts;

namespace TestApp {
    public partial class MainPage : ContentPage {
        public MainPage() {
            InitializeComponent();
        }
        private void Button_Click(object sender, System.EventArgs e) {
            PointSeries pointSeries = (PointSeries)chart.Series[0];
            CustomDataAdapter dataAdapter = (CustomDataAdapter)pointSeries.Data;
            dataAdapter.Next();
        }
    }
    //..
}
Run the application. Now, when a user clicks the Add random point button, a new point appears on the chart.
Refresh the Chart on Data Updates
If your data objects implement the INotifyPropertyChanged interface, you can enable the DataSourceAdapterBase.AllowLiveDataUpdates option to make the chart refresh itself once data object values change. The chart re-renders series and axes to meet data updates.