DevExpress Charts for .NET MAUI
- 2 minutes to read
The DevExpress Charts for .NET MAUI suite helps you transform data to its most appropriate, concise, and readable visual representation.
Download and install the DevExpress.Maui.Charts package from the DevExpress NuGet Gallery to obtain our Charts for .NET MAUI suite. The package contains the following components:
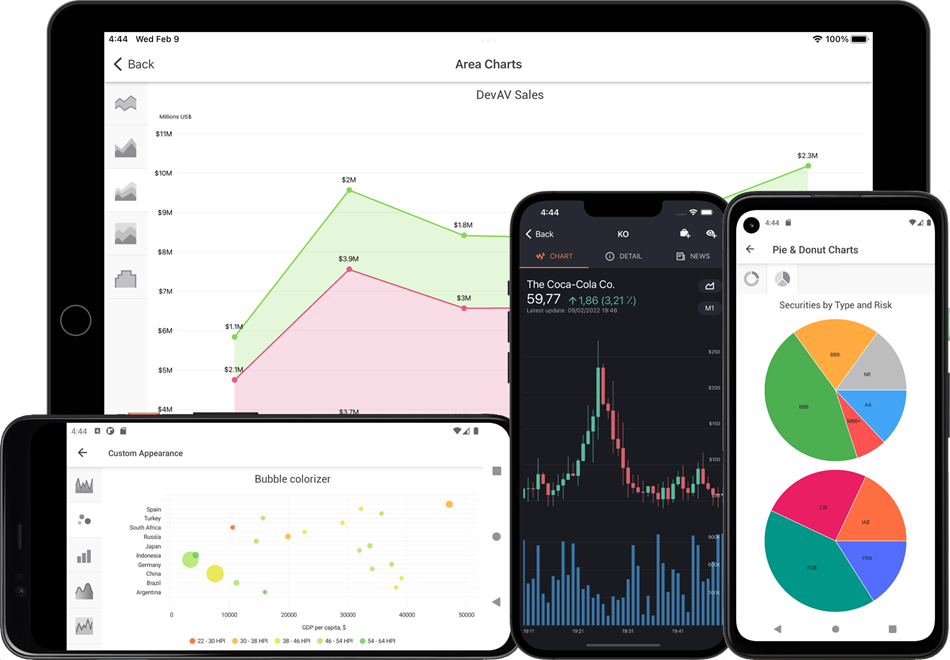
Cartesian Chart
ChartView allows you to display data as bars, lines, areas, financial open-high-low-close views, and more.
Features include:
- Axes
- Rotation
- Legend
- Scrolling & Zooming
- Hints
- Appearance Customization
- Labels
- Selection
- Colorization Algorithms: Series Point Colorizers and Color Gradients for Lines and Areas
Pie Chart
PieChartView allows you to visualize your data as pies and doughnuts.
Features include:
Supported Series Types
For information on all the available charts, see the following topic: Supported Chart Types.
Bind to Data
DevExpress Charts for .NET MAUI use data adapters to consume series data. For more information, refer to the following help topic: Charts for .NET MAUI. Data Adapters.
Examples
For code samples that implement most popular charting usage scenarios, refer to our GitHub repo:
Related Scenarios

Interactive Chart: Bar Selection

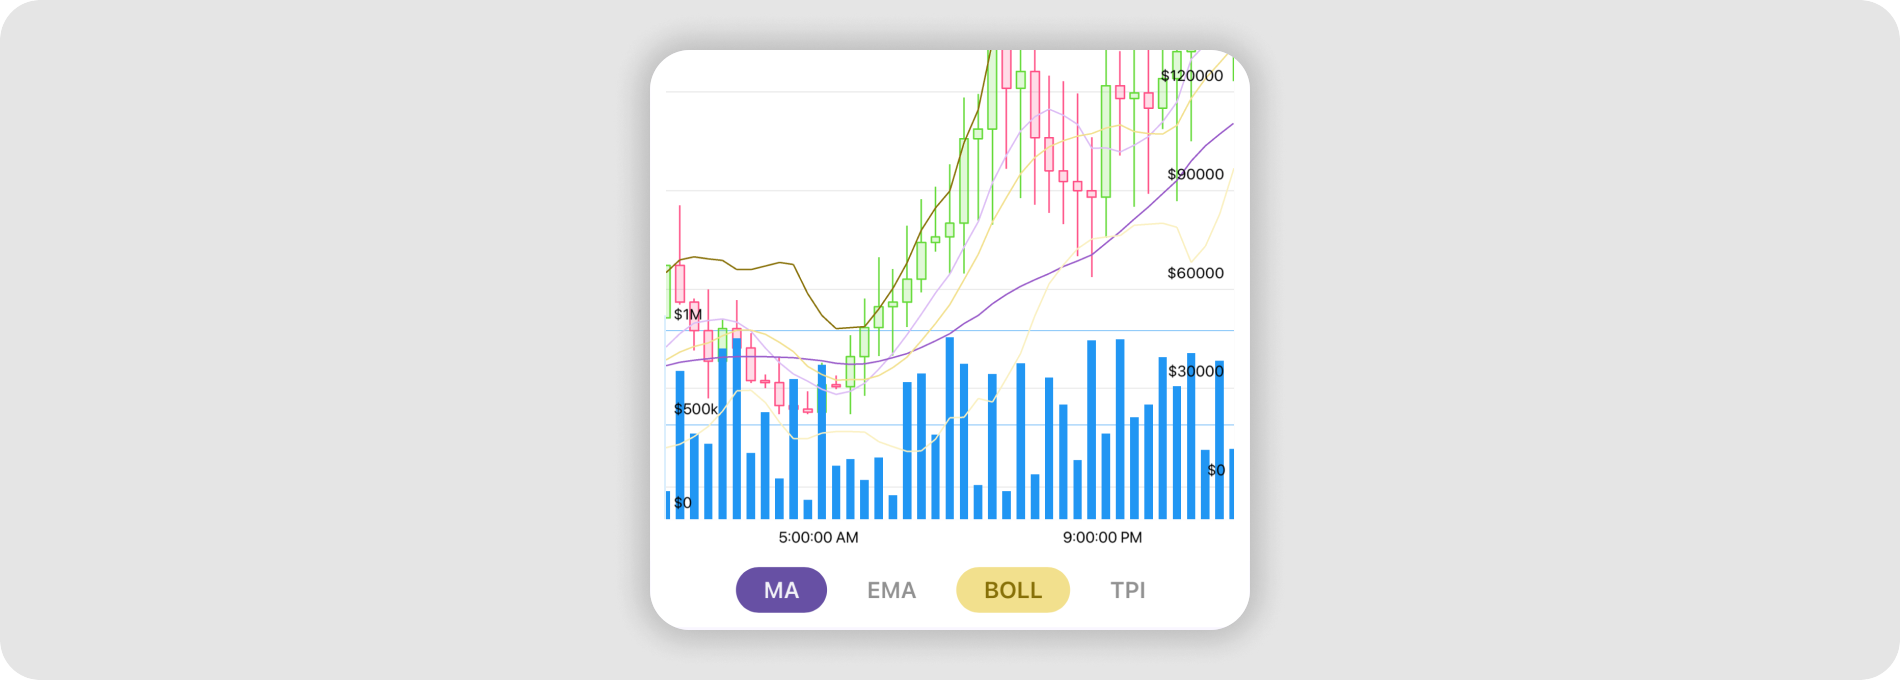
Candlestick Financial Chart with Volume Bars, Indicators and Time Frames
Video
Our video tutorial shows how to create a charting app based on the DevExpress MAUI component library: