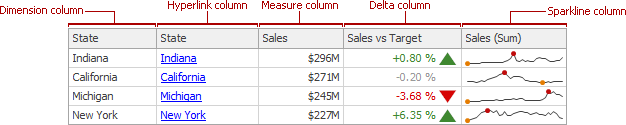
Column Types Overview
The Grid dashboard item supports five column types:
-
Displays grouped values from the bound data item and allows you to provide discrete categorical information.
-
Allows you to display hyperlinks in the Grid dashboard item.
-
Displays summaries calculated against data in the bound data item.
-
Bound to two measures. Calculates summaries for both measures, and displays the difference between these summaries.
-
Displays values in the bound data item using sparklines.
When you drop a data item in the Columns section, it automatically determines the column’s type based on the data.
Column Type Indication
The corresponding data item container in the DATA ITEMS area indicates the column type.

Column type indicators are defined as follows:
| |
| |
| |
| |
|


Changing Column Type
To change the column type, click the column type indicator. In the invoked Column Options window, select the column type from the Column type section.
