RangeAreaSeries.Data Property
Gets or sets the series data.
Namespace: DevExpress.XamarinForms.Charts
Assembly: DevExpress.XamarinForms.Charts.dll
NuGet Package: DevExpress.XamarinForms.Charts
Declaration
public IXYSeriesData Data { get; set; }Property Value
| Type | Description |
|---|---|
| IXYSeriesData | An object that supplies data for the series. |
Remarks
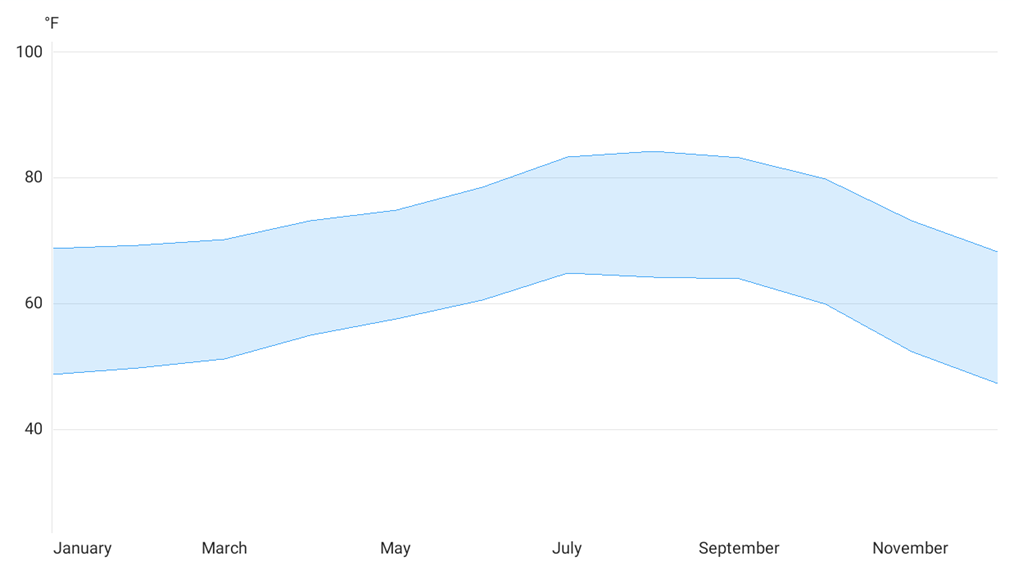
Set the RangeAreaSeries.Data property to the SeriesDataAdapter class instance to bind a range area series to data. Use the adapter’s properties to specify the data source whose members contain an argument field and two value fields (Value1 and Value2).
<ContentPage.BindingContext>
    <local:MainViewModel/>
</ContentPage.BindingContext>
<dxc:ChartView>
    <dxc:ChartView.Series>
        <dxc:RangeAreaSeries>
            <dxc:RangeAreaSeries.Data>
                <dxc:SeriesDataAdapter DataSource="{Binding CATemperature}" ArgumentDataMember="Month">
                    <dxc:ValueDataMember Type="Value1" Member="HighValue" />
                    <dxc:ValueDataMember Type="Value2" Member="LowValue" />
                </dxc:SeriesDataAdapter>
            </dxc:RangeAreaSeries.Data>
        </dxc:RangeAreaSeries>
    </dxc:ChartView.Series>
    <dxc:ChartView.AxisY>
        <dxc:NumericAxisY AlwaysShowZeroLevel="False">
            <dxc:NumericAxisY.Range>
                <dxc:NumericRange Min="30" Max="95"/>
            </dxc:NumericAxisY.Range>
            <dxc:NumericAxisY.Title>
                <dxc:AxisTitle Text="°F" Alignment="Outside"/>
            </dxc:NumericAxisY.Title>
        </dxc:NumericAxisY>
    </dxc:ChartView.AxisY>
    <dxc:ChartView.AxisX>
        <dxc:DateTimeAxisX MeasureUnit="Month">
            <dxc:DateTimeAxisX.Label>
                <dxc:AxisLabel TextFormat="MMMM"/>
            </dxc:DateTimeAxisX.Label>
            <dxc:DateTimeAxisX.Range>
                <dxc:DateTimeRange VisualMin="01/01/2019" VisualMax="12/01/2019"/>
            </dxc:DateTimeAxisX.Range>
        </dxc:DateTimeAxisX>
    </dxc:ChartView.AxisX>
</dxc:ChartView>
public class MainViewModel {
   public List<RangeAreaDataItem> CATemperature { get; }

   public MainViewModel() {
        CATemperature = new List<RangeAreaDataItem> {
           new RangeAreaDataItem(new DateTime(2019, 1, 1), 68.67, 48.59),
           new RangeAreaDataItem(new DateTime(2019, 2, 1), 69.26, 49.72),
           new RangeAreaDataItem(new DateTime(2019, 3, 1), 70.14, 51.07),
           new RangeAreaDataItem(new DateTime(2019, 4, 1), 73.04, 54.94),
           new RangeAreaDataItem(new DateTime(2019, 5, 1), 74.82, 57.50),
           new RangeAreaDataItem(new DateTime(2019, 6, 1), 78.47, 60.51),
           new RangeAreaDataItem(new DateTime(2019, 7, 1), 83.21, 64.71),
           new RangeAreaDataItem(new DateTime(2019, 8, 1), 84.10, 64.17),
           new RangeAreaDataItem(new DateTime(2019, 9, 1), 83.09, 63.81),
           new RangeAreaDataItem(new DateTime(2019, 10, 1), 79.66, 59.82),
           new RangeAreaDataItem(new DateTime(2019, 11, 1), 73.11, 52.24),
           new RangeAreaDataItem(new DateTime(2019, 12, 1), 68.20, 47.20)
       };
   }
}

public class RangeAreaDataItem {
   public DateTime Month { get; }
   public double HighValue { get; }
   public double LowValue { get; }

   public RangeAreaDataItem(DateTime month, double highValue, double lowValue){
       Month = month;
       HighValue = highValue;
       LowValue = lowValue;
   }
}
Important
ChartView chooses the X-axis type depending on data in the first series. If you need to explicitly specify the argument axis type for the chart or an individual series, use the ChartView.AxisX or Series.AxisX property. The assigned object should be compatible with the series data type. Otherwise, the chart does not display the series.
You can also create a custom data adapter, for example, to generate series points dynamically without a separate data storage.