LineSeries.Data Property
Gets or sets the series data.
Namespace: DevExpress.XamarinForms.Charts
Assembly: DevExpress.XamarinForms.Charts.dll
NuGet Package: DevExpress.XamarinForms.Charts
Declaration
public IXYSeriesData Data { get; set; }Property Value
| Type | Description |
|---|---|
| IXYSeriesData | An object that provides data for the series. |
Remarks
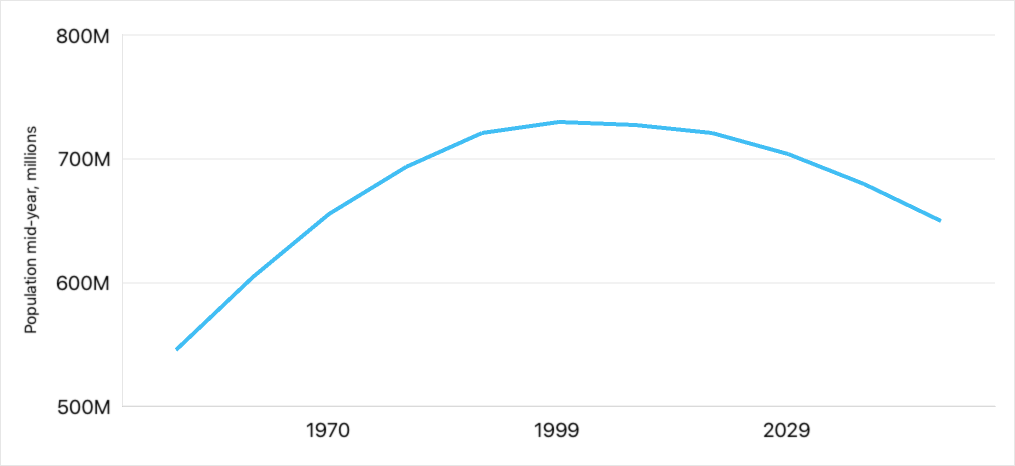
To provide data for the line series, set the LineSeries.Data property to the SeriesDataAdapter class instance. Use the adapter’s properties to specify the data source for the series, and to define the data source members used to generate series points and labels (this series type requires 1 argument and 1 value for a data point).
You can also create a custom data adapter to populate the series with data. For example, it can be useful when data is generated on the fly and you don’t need to store it.
<ContentPage.BindingContext>
    <local:MainViewModel/>
</ContentPage.BindingContext>
<dxc:ChartView>
    <dxc:ChartView.Series>
        <dxc:LineSeries>
            <dxc:LineSeries.Data>
                <dxc:SeriesDataAdapter DataSource="{Binding EuropePopulationData}"
                                       ArgumentDataMember="Year">
                    <dxc:ValueDataMember Type="Value" Member="Population"/>
                </dxc:SeriesDataAdapter>
            </dxc:LineSeries.Data>
        </dxc:LineSeries>
    </dxc:ChartView.Series>
</dxc:ChartView>
public class MainViewModel {
   public List<DateTimeData> EuropePopulationData { get; }

   public MainViewModel() {
       EuropePopulationData = new List<DateTimeData> {
           new DateTimeData(new DateTime(1950, 1, 1), 546),
           new DateTimeData(new DateTime(1960, 1, 1), 605),
           new DateTimeData(new DateTime(1970, 1, 1), 656),
           new DateTimeData(new DateTime(1980, 1, 1), 694),
           new DateTimeData(new DateTime(1990, 1, 1), 721),
           new DateTimeData(new DateTime(2000, 1, 1), 730),
           new DateTimeData(new DateTime(2010, 1, 1), 728),
           new DateTimeData(new DateTime(2020, 1, 1), 721),
           new DateTimeData(new DateTime(2030, 1, 1), 704),
           new DateTimeData(new DateTime(2040, 1, 1), 680),
           new DateTimeData(new DateTime(2050, 1, 1), 650)
       };
   }
}

public class DateTimeData {
   public DateTime Year { get;}
   public double Population { get; }

   public DateTimeData(DateTime year, double population) {
       this.Year = year;
       this.Population = population;
   }
}
Important
ChartView chooses the X-axis type depending on data in the first series. If you specify the axis X for the chart or an individual series, set the ChartView.AxisX or Series.AxisX property to an object that is compatible with the series’ data type (otherwise, the chart does not display the series).